- With yields on the Bloomberg US Aggregate Bond Index recently eclipsing 5%, history suggests now could be an opportune time for investors to add core bonds to their portfolios.
- Investors can take advantage of the rise in yields — which move in the opposite direction of bond prices — by extending duration, which is a measure of a bond’s interest rate sensitivity.
- Core bonds can play an important role in portfolios by adding diversification to equity exposures. During market downturns, investors often seek safety in the type of high-quality bonds found in the Bloomberg US Aggregate Bond Index.
Should investors add duration to bond portfolios now?
Sep 20, 2023 Fixed Income
KEY TAKEAWAYS
With interest rates at the highest levels in since 20071, investors are rotating back into core fixed income. The iShares Core U.S. Aggregate Bond ETF (AGG), for example, has taken in $10.7 billion of inflows this year, reflecting this shift.2
History suggests it’s not too late for investors to increase their fixed-income allocations, as core bond yields just reached 5.1% as of 8/15/20233. The last time yields were over 5% was in October 2008 and the return of the Bloomberg Aggregate Bond Index was 13.79% next 12 months. This occurred as bonds had positive returns both from income and capital appreciation over the next 12-month period following yields at these 5% levels4. Investors can take advantage of the rise in yields — which move in the opposite direction of bond prices — by extending duration with AGG.
(Duration is a measure of interest rate sensitivity — for every 1% rise in interest rates a bond’s price will decline by the duration. For a bond with a duration of 5 years, the bond’s price will decline by about 5% if interest rates rise by 1%. So if rates rise from here, a bond’s prices will likely decline. However, the total return of a bond includes both the income payments and any change in price. With a 5% yield, rates would need to rise by about 1% to cause a negative total return over a one year holding period.)
Bloomberg US Aggregate Bond Index yields
(AGG's benchmark index)
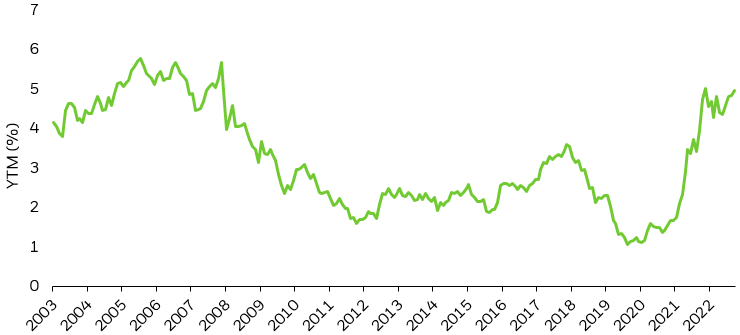
Bloomberg US Aggregate Bond Index yield to worst monthly from 9/30/2003 to 8/15/2023. Index performance is for illustrative purposes only. Index performance does not reflect any management fees, transaction costs or expenses. Indexes are unmanaged and one cannot invest directly in an index. Past performance does not guarantee future results.
Chart description: Line chart showing yields on the Bloomberg Aggregate Bond Index (AGG) from 2003 to the present. The yield on the AGG Index recently rose above 5% for the first time since 2008.
BUILD YOUR CORE WITH AGG
While past returns don’t guarantee future performance, bonds have historically played three important roles in portfolios, offering potential income, diversification, and capital preservation.
The diversification element may be most important right now, as BlackRock’s analysis shows the average 60/40 portfolio is underweight fixed income by 7%.5 In other words, many investors are overly exposed to equities and could consider AGG to fill out the bond mix of their asset allocation.
AGG can serve an important role in portfolios adding diversification to equity exposures. During market downturns, investors often seek safety in high-quality bonds. AGG historically has outperformed stocks during selloffs, as detailed in the graphic below.
AGG outperforms during recent market storms
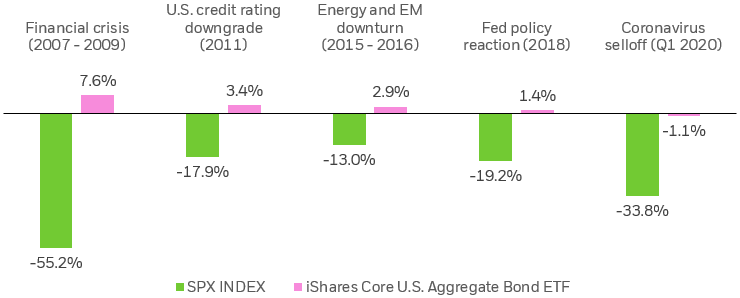
Source: Morningstar, as of 6/30/2023. ETF performance uses NAV returns. Financial Crisis measured 10/10/07 – 3/9/09, US Credit Rating Downgrade measured 7/25/11 – 10/3/11, Energy and EM Downturn measured 7/21/15 – 2/11/16, Fed Policy Reaction measured 1/29/18 – 2/8/18, Coronavirus Selloff measured 2/19/20-3/23/20. Performance data represents past performance and does not guarantee future results. Investment return and principal value will fluctuate with market conditions and may be lower or higher when you sell your shares. Current performance may differ from the performance shown. For most recent month-end performance see www.iShares.com. For standardized performance, see AGG’s product page.
Chart description: Bar chart showing the outperformance of the iShares Core U.S. Aggregate Bond ETF vs. the S&P 500 during recent bouts of market upheaval, including the 2008 financial crisis, 2011 U.S. debt downgrade, and 2020 Coronavirus selloff.
Here are three surprising facts about AGG and its index:
Know what you own: The index that AGG seeks to track only includes taxable investment grade bonds — you won’t find any high yield or tax-exempt municipal bonds in here. Nearly 70% of the fund is allocated to high-quality, government-backed securities including U.S. Treasuries and agency mortgage-backed securities (MBS).6 The remaining 30% is invested in corporate bonds, non-corporate credit, and taxable municipal securities, offering investors more diversification in their fixed-income portfolio compared to just owning government securities.7 And AGG’s expense ratio is just 0.03%.
The most popular fixed income benchmark: Over $4.9 trillion assets under management in fixed income mutual funds, ETFs, pooled vehicles and separately managed accounts use the Bloomberg US Aggregate Bond Index as a benchmark for performance measurement or aim to track it directly8.
Rooted in a half-century of bond history: The Bloomberg US Aggregate Bond Index was incepted in 1973 (50 years ago!) as a government-credit index that calculated total returns to measure bond market performance similar to equity market indices. Prior to the publication of the Aggregate Bond Index, only average yields for bonds were available9, rather than total returns. Over time, the index rules began to include securitized bonds and taxable munis to reflect the composition of the broad bond market.
