Flow & Tell with iShares | March 2024 ETF Flows

MARCH ETF FLOWS

It’s safe to assume very few March (market) brackets included U.S. equities eking out new all-time highs, Fed Chair Powell holding rates steady, and airplane doors falling off mid-flight. Here’s what that all (minus the plane parts) spelled for the month’s top ETF flows:


March ETF heat map

March ETF flows compared with index performance

Scatter plot showing the relationship between index performance and ETF sub-asset class flows for March 2024.

Source: BlackRock, Bloomberg, chart by iShares Investment Strategy. As of April 1, 2024. Flows normalized by AUM as of March 31, 2024. Index performance is for illustrative purposes only. Index performance does not reflect any management fees, transaction costs or expenses. Indexes are unmanaged and one cannot invest directly in an index. Past performance does not guarantee future results. Index performance is measured by the following indexes: EM  Equity: MSCI Emerging Markets IMI Index; Gold: ICE LBMA Gold Price Index; U.S. Treasury: ICE BofA 10-Year U.S. Treasury Index; Communication Services: S&P 500 GICS Level 1 Communication Services Sector Index; Utilities: S&P 500 GICS Level 1 Utilities Sector Index; HY Credit: iBoxx USD High Yield Index; Commodities: S&P GSCI Index; Information Technology: S&P 500 GICS Level 1 Information Technology Sector Index; Consumer Staples: S&P 500 GICS Level 1 Consumer Staples Sector Index; Health Care: S&P 500 GICS Level 1 Health Care Sector Index; Financials: S&P 500 GICS Level 1 Financials Sector Index; Industrials: S&P 500 GICS Level 1 Industrials Sectors Index; Energy: S&P 500 GICS Level 1 Energy Sectors Index. Coloring is based on quadrants: quadrant I: green; quadrant II: yellow; quadrant III: pink; quadrant IV: purple.

Chart description: Scatter plot showing the relationship between index performance and ETF sub-asset class flows for March 2024.


1. BONDS ON SPRING BREAK

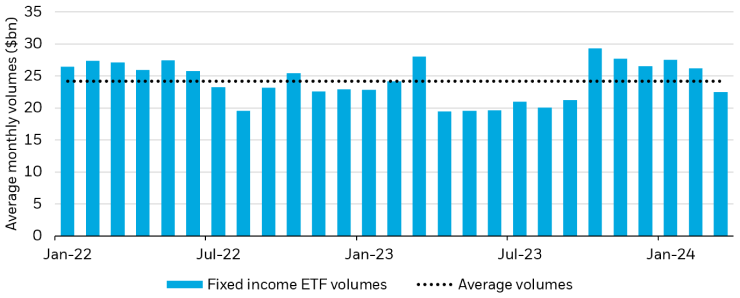
Fixed income ETFs logged a notable decline in volumes in March, averaging $22.5bn traded daily, its lowest level since September. Fixed income ETF share of total equity trading sank to its smallest percentage in 27 months (December 2021, for the finger-counting readers).1 This downtick was fixed income specific – equity ETF volumes chugged along, up on the margin month-over-month and above their historic averages.2

Subdued volumes translated to subdued flows: while equity flows tend to outnumber their fixed income counterparts, that ratio hovers typically around a 30% to 70% split.3 In March, that proportion dipped to 18% fixed income, and 82% equity.

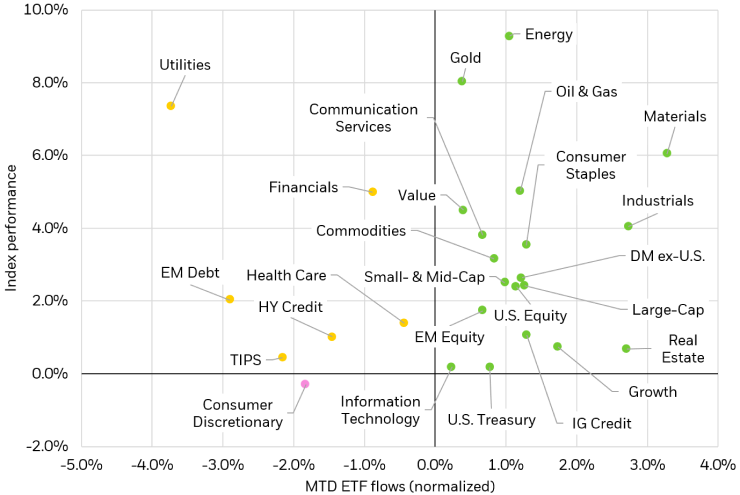
Broad allocations led inflows, with credit exposures as the second largest asset gatherer.4 Despite strong performance in the high yield market, HY ETFs saw outflows on the month. Duration preferences underscored a similar divergence between flows and performance: intermediate Treasuries added inflows while the front end of the curve saw sharp outflows, to the tune of $2.7bn, even on the heels of narrow outperformance.5

Fixed income monthly volumes decline

Bar chart showing fixed income ETF volumes dating to January 2022.

Source: Bloomberg, BlackRock, Markit. ETF groupings determined by Markit. As of March 31, 2024.

Chart description: Bar chart showing fixed income ETF volumes dating to January 2022.


2. CHINA A-

China equities were still in the doldrums in Q1, mirroring last year’s negative price action. The Hang Seng Index was the worst-performing major benchmark in the world last year, and despite stemming its slide in March, remains in negative territory on the year.6

Flows were equally pessimistic. In 2023, China registered the largest outflows of single country exposures, despite starting the year as the largest asset gatherer (more than 3x the inflows of 2nd place India).7 This year continues the downtrend: in March, China ETFs saw $927mn outflows.8 Poor investor sentiment in China spurs opportunity for other Asian countries to bridge the gap – March’s Bank of America Fund Manager Survey, which canvasses the views of 300 fund managers, found that short China equities was the second most crowded trade on the month, closely followed by long Japanese equities. Japan ETF flows further color this narrative, with March’s $372mn addition bringing YTD totals to $3.5bn.9 We continue to see a strong case for increased allocations to Japan.

China remains in outflow mode

Line chart showing cumulative flows for Japan ETFs and China ETFs.

Source: Bloomberg, BlackRock, Markit. ETF groupings determined by Markit. As of March 31, 2024.

Chart description: Line chart showing cumulative flows for Japan ETFs and China ETFs.


3. DESTINATION: EM

With U.S. markets flirting with all-time highs, investors globally are looking elsewhere for compelling opportunities to ride the global wave. The current destination-du-jour: active emerging market ETFs. The product asset-class has seen just over $17bn in inflows since the start of 2023, a trend that only accelerated in March, where active emerging market ETFs globally saw $416mn of inflows.10 That March number makes up a stunning 33% of flows towards all emerging market ETFs.

The need to be selective has fueled active adoption. In fixed income, enticing all-in yields are countered by historically tight credit spreads, making navigating the opportunity set trickier and "set it and forget it" strategies less appealing. In emerging markets, geopolitical tensions, shifting global supply chains, and divergent monetary policy underscore the need for a more active approach. Increasingly, investors are opting into active ETFs for these exposures, tapping trusted managers while sticking with the tax efficiency of the ETF wrapper.

Betting on active abroad

Bar chart depicting EM index ETFs versus EM active ETFs as a percentage of March ETF flows, and CAGR since 2023

Source: BlackRock, Bloomberg, Markit. ETF groupings determined by Markit. Includes all globally listed ETFs, USD denominated figures. As of March 31, 2024.   CAGR as defined by compound annual growth rate, which measures annual growth over a period of time (since January 01, 2023, to March 31, 2024)

Chart description: Bar chart depicting EM index ETFs versus EM active ETFs as a percentage of March ETF flows, and CAGR since 2023.


FEATURED FUNDS

Kristy Akullian, CFA

Kristy Akullian, CFA

Senior member of the iShares Investment Strategy

Faye Witherall

Investment Strategy

Contributor

Nick Morales

Investment Strategy

Contributor