Outline for the Election Playbook: Part 1

Politics and portfolios: navigating markets during an election year.

1. STAYING INVESTED HAS BEEN MORE IMPORTANT THAN WHO WINS

Markets don’t vote in elections, but they do vote with their feet. And in that regard, they are strictly non-partisan. While party jostling may dominate headlines, historically markets have continued to march higher regardless of who holds power. 

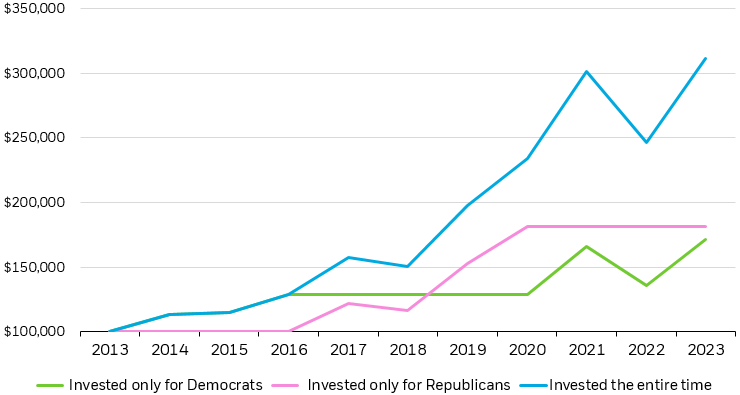
Under the hood, party control may influence sector and industry performance, but at the broad index level staying invested has been more important than which party holds the presidency.1 Consider two horizons: over the last ten years, money invested only under Republican presidents returned slightly more than money invested during Democratic reign. But by far the winning investment strategy was to stay invested, even as political power changed hands. Investors who held the course as political winds changed earned nearly twice as much in the last decade as those who plumped purely for their party (Figure 1).

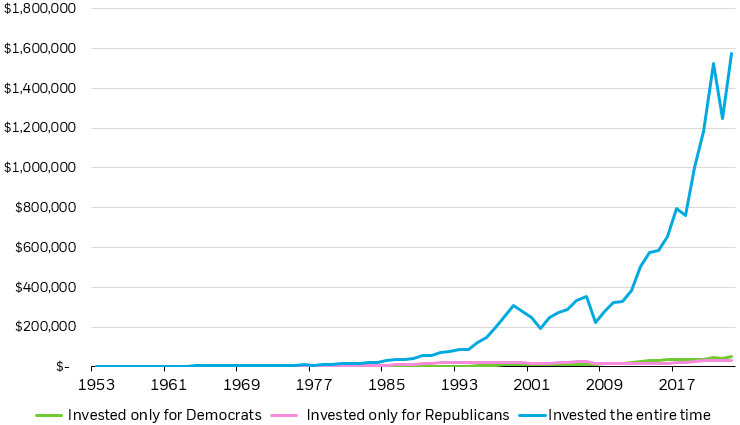
Over the very long term the same is true, but at much greater magnitude. Over the last 70 years, market performance during Democratic presidencies edged out their Republican counterparts. But bipartisan investors took home the real prize, earnings 31x more than the party faithful (Figure 1).

Index investing can be a good way to diversify company specific risk, as elections can benefit some and not others, but are notoriously hard to predict. Rather than selecting funds with exposures tied to the fate of a single party, investors may consider allocating to a diversified basket of high-quality companies that have been shown to stand the test of time — regardless of who’s in power.

Figure 1

Last 10 years, $100,000 invested in 2013, depending on which party held presidency

Line chart showing the appreciation of $100,000 invested in U.S. large-cap stock during democratic presidential terms only, republican presidential terms only, and the entire time, since 2013.

Source: BlackRock, Morningstar, as of December 31, 2023. Party presidency period determined by party presidency inauguration to next opposing party presidency inauguration. Stock market represented by the S&P 500 Index from 1/1/70 to 12/31/23 and IA SBBI U.S. large cap stocks index from 1/1/54 to 1/1/70. Past performance does not guarantee or indicate future results. Index performance is for illustrative purposes only. You cannot invest directly in an index.

Chart description: Line chart showing the appreciation of $100,000 invested in U.S. large-cap stocks during democratic presidential terms only, republican presidential terms only, and the entire time, since 2013.


Last 70 years, $1,000 invested in 1953, depending on which party held presidency

Line chart showing the appreciation of $1,000 invested in U.S. large-cap stock during democratic presidential terms only, republican presidential terms only, and the entire time, since 1953.

Source: BlackRock, Morningstar, as of December 31, 2023. Party presidency period determined by party presidency inauguration to next opposing party presidency inauguration. Stock market represented by the S&P 500 Index from 1/1/70 to 12/31/23 and IA SBBI U.S. large cap stocks index from 1/1/54 to 1/1/70. Past performance does not guarantee or indicate future results. Index performance is for illustrative purposes only. You cannot invest directly in an index.

Chart description: Line chart showing the appreciation of $1,000 invested in U.S. large-cap stocks during democratic presidential terms only, republican presidential terms only, and the entire time, since 1953.


2. BRACE FOR VOLATILITY AND DON’T BET ON A BLOCKBUSTER

More than anything, markets dislike uncertainty, and election years often bring a healthy dose. Looking back at past presidential election years, we find that median index returns are positive, but below the average of non-election years. More specifically, markets have tended to struggle in the first half of the year, when uncertainty about the outcome is typically highest (Figure 2). As election day nears, candidates are known, and polls become more reliable, markets have historically delivered positive performance in the third and fourth quarters (Figure 2).

But while historical analogs can be encouraging, they also reveal risks. Election years tend to have a wider range of potential outcomes in either direction, particularly when political power changes hands. That risk rises even more when one party consolidates power in both chambers of Congress and in the Executive branch, as divided government often stymies sweeping changes, reducing uncertainty.2

While election attention — and the impact on markets — typically begins in earnest in the fall, this election cycle may pull forward focus, as both likely candidates and their policy agendas are largely known in advance. This could create a bumpy ride through an already busy macro calendar, featuring the Fed potentially set to cut interest rates over the summer. Investors who want to smooth the ride might consider buffered strategies, where the certainty of downside protection may be welcome in an otherwise uncertain year.

A buffer strategy utilizes options to seek to provide a targeted level of downside protection, should markets experience negative returns. The tradeoff for this downside protection is that the strategy is limited on its upside potential over each hedge period. Together, this approach can help investors stay invested by mitigating the pain of major selloffs and ultimately seek clearer financial outcomes (For more, see 5 Questions on Buffer ETFs | BlackRock).

Figure 2

Stocks have historically struggled in the first half of a presidential election year

Line chart depicting stock performance during election years categorized by when the incumbent party wins, opposing party wins, and the average of all election years.

Source: BlackRock, Bloomberg. Dr. Ken French, Dartmouth University. U.S. stock returns from 1932 to 1956 are represented by the U.S. stock market daily returns data set compiled by Dr. French. U.S. stock market returns from 1957 to 2020 represented by SPX Index. Index performance is for illustrative purposes only. Index performance does not reflect management fees, transaction costs or expenses. Indexes are unmanaged and one cannot invest directly in an index. Past performance does not guarantee future results.

Chart description: Line chart depicting stock performance during election years categorized by when the incumbent party wins, opposing party wins, and the average of all election years.


3. FIND COMMON GROUND – OR AT LEAST COMMON INVESTMENT THEMES.

Even though election years often emphasize the differences between major parties and their candidates, investors may be better served in their portfolio by identifying commonalities: areas of the economy that can benefit from bipartisan support and can flourish regardless of who wins in November. We see two key area for investment where parties can find common ground.

  • Thankfully, roads, bridges, and power grids tend not to lean left or right (hopefully they don’t lean at all!). As a result, we believe domestic infrastructure spending is likely to continue in 2025, though the flavor of spending may be colored by party politics. Investing in the theme, rather than specific companies, can give you diversified exposure to companies who should benefit as infrastructure spending continues, which it is set to do thanks to the $1.2 trillion Infrastructure Investment and Jobs Act passed in 2021.
  • Geopolitical fragmentation in a world of increasing competition between “the West and the Rest” has led to a rethink of global supply chains. Technology companies, at the forefront of U.S. growth in 2023, are in many cases leading the way. We see opportunity in tech-focused funds that take on an active approach, using geolocation data to tilt into tech companies focused on the U.S. and “friend-shored” tech production and distribution. We believe this unique offering captures an evolving geopolitical reality and believe the focus on this exposure will only continue as election rhetoric picks up, with both sides keen to rebuild domestic manufacturing. 

Figure 3

“Reshoring” Google Search Trends and U.S. Company Job Announcements (2010-2022)

Bar chart showing reshoring job announcements per year since 2010, overlaid by a line chart showing Google search trends for "reshoring".

Source: Google. Google Trends as of October 31, 2022. Numbers represent search interest relative to the highest point on the chart for the given region and time. A value of 100 is the peak popularity for the term. A value of 50 means that the term is half as popular. A score of 0 means there was not enough data for this term.

Chart description: Bar chart showing reshoring job announcements per year since 2010, overlaid by a line chart showing Google search trends for "reshoring".


Photo: Kristy Akullian, CFA

Kristy Akullian, CFA

Senior member of the iShares Investment Strategy