1 Source: BlackRock, Bloomberg. As of June 30, 2023. S&P 500 as represented by the SPX Index, ‘info tech’ as represented by the S&P 500 Information Technology Sector Index. Index performance is for illustrative purposes only. Index performance does not reflect any management fees, transaction costs or expenses. Indexes are unmanaged and one cannot invest directly in an index. Past performance does not guarantee future results.
Flow & Tell with iShares – Rounding up standout H1 2023 flows
Jul 20, 2023 Global
The past six months delivered a liquidity crunch on three regional bank failures, a debt ceiling debacle, and the prospect of even higher interest rates. The result? The S&P 500 climbed over 15%, tipping into bull market territory in early June led by the info tech sector returning over 42%.¹ We saw key flows as investors navigated this year’s price action, often utilizing ETFs to do so.
10 STANDOUT ETF FLOWS THAT DEFINED THE FIRST HALF OF 2023
The first half of the year was all about fixed income ETFs: the asset class added $102 billion in net assets, on pace to be one of the largest years of inflows ever. That brings assets under management in fixed income ETFs in the U.S. to over $1.3 trillion — speaking to the widespread adoption of the vehicle to manage fixed income exposures.2 This is part of a global trend, in which we’ve seen fixed income ETF AUM surpass $2 trillion.3
Domestic equities are also on solid footing, adding $128 billion in net assets in the first half of the year. What started as a slow year for equities was quickly reversed in Q2, with ~75% of inflows year-to-date coming in the second quarter as equities continued to rally.4
Broad ETF flows in the first half of 2023
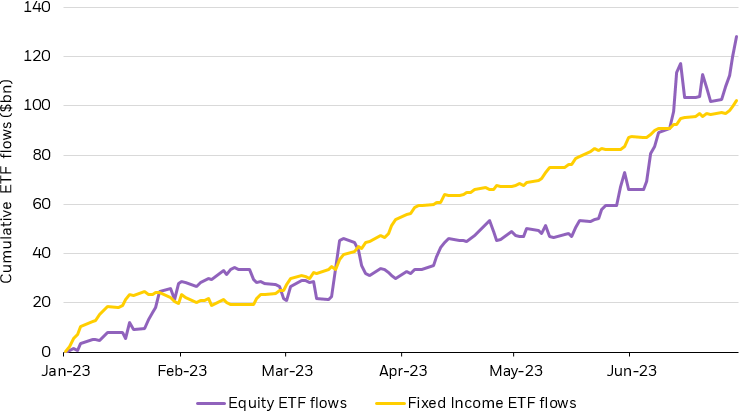
Source: BlackRock, Bloomberg, Markit. ETF groupings determined by Markit. As of June 30, 2023. All flows pictured are domestic flows.
Chart description: Line chart depicting cumulative YTD flows for both equity and fixed income ETFs.
2 Source: BlackRock, Markit. ETF groupings determined by Markit. As of June 30, 2023.
3 Source: BlackRock, Markit. ETF groupings determined by Markit. As of July 12, 2023.
4 Source: BlackRock, Markit. ETF groupings determined by Markit. As of June 30, 2023.
Fixed income allocations turned defensive amid 2023’s uncertain macroeconomic backdrop: March’s regional bank madness sent investors flocking to high quality investment grade exposures — mostly funded from outflows in riskier high yield exposures. Indeed, high yield ETFs shed $3.6 billion in outflows while their IG counterparts collected $7.1 billion inflows on the year.5
5 Source: BlackRock, Markit. ETF groupings determined by Markit. As of June 30, 2023.
While investors grapple with record market concentration in the S&P 500, equal-weighted ETFs have seen significant inflows at the prospect of the rest of the index “catching up” to the high-flyers. Equal-weighted ETFs added $6.0 billion, $4.7 billion of which came in Q2 2023.6 Whether the laggards “catch-up” or the high-performers “catch-down” remains to be seen, but a sizable number of investors look to be placing bets on the former.
6 Source: BlackRock, Markit. ETF groupings determined by Markit. As of June 30, 2023.
Since 2015, active ETFs have grown in assets under management from under $20 billion to over $430 billion as of 2023.7 Much of the growth has come in just the past two years: both 2021 and 2022 saw over $100 billion in net inflows. The first half of this year is right in line with that growth, with active ETFs adding $54 billion in net inflows in the first half of the year, nearly a quarter of all ETF inflows.8
AUM increase in active ETFs
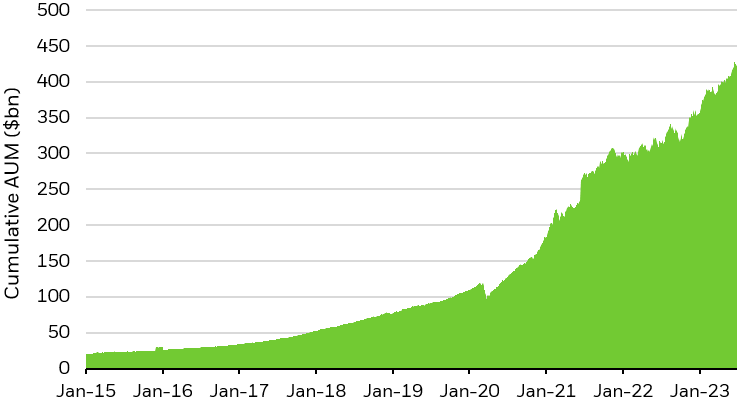
Source: BlackRock, Bloomberg, Markit. ETF groupings determined by Markit. As of June 30, 2023.
Chart description: Area chart depicting cumulative AUM in active ETFs from 2015 to 2023, showing a steady positive trend.
7 Source: BlackRock, Markit. ETF groupings determined by Markit. As of June 30, 2023.
8 Source: BlackRock, Markit. ETF groupings determined by Markit. As of June 30, 2023.
In the energy sphere, flows have been in outflow mode as a corollary of the sector’s YTD performance — while energy unfolded as the sole winner in 2022, the sector emerged as the biggest drag in the first half of 2023, sinking 7.3% while the broader market returned nearly 16%.9 In turn, energy ETFs have clocked $11.6 billion in outflows this year, the biggest loss across sector funds.10
9 Source: BlackRock, Bloomberg. As of June 30, 2023. ‘Broader market’ in reference to the SPX Index, sectors as determined by the Global Industry Classification Standard (GICS).
10 Source: BlackRock, Markit. ETF groupings determined by Markit. As of July 10, 2023.
Investors shopped abroad in January, adding nearly $8.9 billion into emerging market (EM) equities, three times more than the average monthly inflows in the year prior.11 Developed markets (DM) ex-U.S. registered $16 billion in inflows for Q1 as U.S. equities netted $1.7 billion in outflows, underscoring investors’ overseas preference.12 This reversed in Q2, as U.S. equities captured $76.4 billion on the quarter, 53% more than other regional allocations combined.
A contrarian to this U.S.-dominant reversal is a more granular example: Japan emerged as a standout country, netting $4.7 billion in the first half of the year as the country’s benchmark index surged nearly 30%, far outstripping U.S. gains.13 Indeed, EWJ (iShares MSCI Japan ETF) captured $2.57 billion in inflows in Q2, its highest quarterly inflows in the past decade.
11 Source: BlackRock, Markit. ETF groupings determined by Markit. As of January 31, 2023.
12 Source: BlackRock, Markit. ETF groupings determined by Markit. As of June 30, 2023.
13 Source: BlackRock, Bloomberg. Japan benchmark index in reference to the Nikkei 225, whereas U.S. benchmark index in reference to the S&P 500. As of July 10, 2023. Indexes are unmanaged and one cannot invest directly in an index. Past performance does not guarantee future results.
Investors leaned into value-focused equities in 2022 as rising real rates battered growth exposures — expectations for future profits faced a resilient adversary in Fed Chair Powell’s seven consecutive rate hikes. Today, a significant divergence in performance has emerged between value and growth exposures, a gap widened by March’s regional bank crisis while the tech-rally led growth gains higher.14 Flows followed suit — growth ETFs have netted $13.0 billion YTD, whereas value ETFs have shed over $16.2 billion.15
14 Source: Bloomberg. As of June 30, 2023. ‘Value exposures’ in reference to the S&P 500 Value Index, ‘growth exposures’ in reference to the S&P 500 Growth Index.
15 Source: BlackRock, Markit. ETF groupings determined by Markit. As of July 10, 2023.
The tech-heavy Nasdaq clocked its best start to the year in four decades through June, returning the most since 1983 (back when Apple was the sole FAANG company, still in its infancy).16 Part of the price action can be traced to AI fervor, with chipmaker behemoth Nvidia leading the way with a 190% rally.17 In fact, investors have added nearly $1.0 billion so far in H1 into AI and robotics focused ETFs, fueled by future optimism for hypergrowth.18
Inflows to AI & Robotics ETFs, AI mentions on earnings calls

Source: BlackRock Investment Institute, Bloomberg, Markit. ETF groupings determined by Markit. The blue line shows the three-month rolling sum of mentions of ‘artificial intelligence’ in publicly listed company earnings releases or earnings calls with analysts. As of June 30, 2023.
Chart description: Line chart depicting AI mentions on earnings calls and cumulative inflows to AI & Robotics ETFs since 2015.
16 Source: Bloomberg. As of June 30, 2023. Specific companies or issuers are mentioned for educational purposes only and should not be deemed as a recommendation to buy or sell any securities. Any companies mentioned do not necessarily represent current or future holdings of any BlackRock products. For actual ETF holdings, please visit a fund’s profile page on www.ishares.com.
17 Source: Bloomberg. As of June 30, 2023. Specific companies or issuers are mentioned for educational purposes only and should not be deemed as a recommendation to buy or sell any securities. Any companies mentioned do not necessarily represent current or future holdings of any BlackRock products. For actual ETF holdings, please visit a fund’s profile page on www.ishares.com.
18 Source: BlackRock, Markit. ETF groupings determined by Markit. As of June 16, 2023.
Term-maturity ETFs — funds that are designed to act like traditional bonds in that they provide regular interest payments and also distribute a final payout in its stated maturity year, unlike regular fixed income ETFs, which reinvest at maturity — have added $7.8 billion in assets in the first half of 2023.19 Investors looking to lock in higher yields have turned to the diversification and tradability of the ETF wrapper to do so. Short-term investment grade corporate term-maturity ETFs have been the most popular category, but inflows into U.S. treasury term-maturity ETFs have also seen strong inflows.
19 Source: BlackRock, Markit. ETF groupings determined by Markit. As of June 30, 2023.
Aggregate bond ETFs reigned as favored exposures in 2023, collecting over $30.2 billion in the first half of the year, a sizeable feat representing over 80% of inflows netted in 2022’s entire calendar year.20 Flows into high quality exposures along the curve marked a ‘flight to safety’ trade in H1, in line with historic trends — since January 2020, the exposure has only registered 3 months of outflows.21
US aggregate bond ETFs remain in positive territory
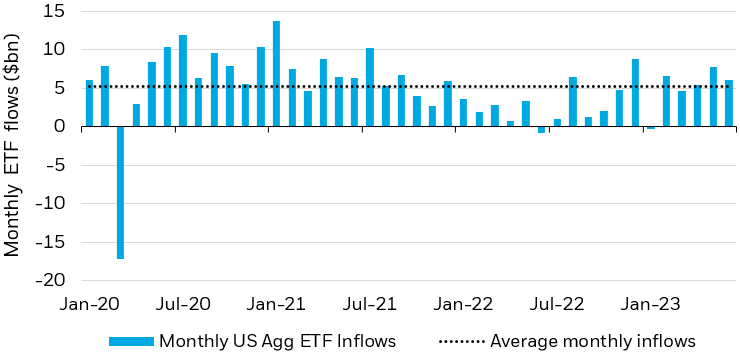
Source: BlackRock, Markit. ETF groupings determined by Markit. As of June 30, 2023.
Chart description: Bar chart showing monthly inflows to US Agg ETFs since January 2020, overlayed with average monthly inflows as a dotted line.
20 Source: BlackRock, Markit. ETF groupings determined by Markit. As of July 10, 2023.
21 Source: BlackRock, Markit. ETF groupings determined by Markit. As of July 10, 2023.
