Flow & Tell with iShares | May 2024 ETF Flows

MAY FLOWS

Equity markets hit new highs in May as strong micro (Q1 earnings) and macro (cooling inflation prints) catalysts lifted the S&P 500. Despite the month’s FOMC meeting, paired with a slug of Fedspeak, leaving rate expectations largely unchanged, small caps rallied in tandem. But broad equity strength didn’t translate to all inflows, all the time — here are the top ETF trends for the month of May:

MAY ETF HEAT MAP


May ETF flows compared with index performance

Scatter plot showing the relationship between index performance and ETF sub-asset class flows for May 2024.

Source: BlackRock, Bloomberg, chart by iShares Investment Strategy. As of June 1, 2024. Flows normalized by AUM as of May 31, 2024. Index performance is for illustrative purposes only. Index performance does not reflect any management fees, transaction costs or expenses. Indexes are unmanaged and one cannot invest directly in an index. Past performance does not guarantee future results. Index performance is measured by the following indexes: EM  Equity: MSCI Emerging Markets IMI Index; Gold: ICE LBMA Gold Price Index; U.S. Treasury: ICE BofA 10-Year U.S. Treasury Index; Communication Services: S&P 500 GICS Level 1 Communication Services Sector Index; Utilities: S&P 500 GICS Level 1 Utilities Sector Index; HY Credit: iBoxx USD High Yield Index; Commodities: S&P GSCI Index; Information Technology: S&P 500 GICS Level 1 Information Technology Sector Index; Consumer Staples: S&P 500 GICS Level 1 Consumer Staples Sector Index; Health Care: S&P 500 GICS Level 1 Health Care Sector Index; Financials: S&P 500 GICS Level 1 Financials Sector Index; Industrials: S&P 500 GICS Level 1 Industrials Sectors Index; Energy: S&P 500 GICS Level 1 Energy Sectors Index. Coloring is based on quadrants: quadrant I: green; quadrant II: yellow; quadrant III: pink; quadrant IV: purple.

Chart description: Scatter plot showing the relationship between index performance and ETF sub-asset class flows for May 2024.


CHINA FLOWS

April showers (in the form of broad risk asset losses) indeed spurred May flowers, and not just at the Met Gala’s ‘Garden of Time’ black-tie extravaganza. U.S. equity markets shook off April’s negative performance to register broad gains, with all eleven GICS sectors ending higher. The domestic sentiment reversal followed a drastic swing already playing out overseas — the Hang Seng Index extended its four-month winning streak in May after three consecutive quarters of losses.

Expectations for more policy support from Beijing for the badly beaten property sector fueled recent optimism, but the rally may be running out of steam — May’s monthly Hang Seng gains declined from April levels, and the CSI 300 dipped negative in May, its first monthly loss since January. Still, flows chased performance, and May marked the largest month of inflows into China ETFs in 1.5 years, after largely negative monthly averages since 2022.1

Figure 1: China flows turn positive

Bar chart showing monthly flows into China ETFs since January 2023.

Source: BlackRock, Bloomberg, Markit. ETF groupings determined by Markit. As of June 4, 2024.

Chart description: Bar chart showing monthly flows into China ETFs since January 2023.


FEATURED FUNDS

AMPED RETURNS, DIMMED INFLOWS

The surge in investor enthusiasm for artificial intelligence has spilled over to the utilities sector, which clocked its best month since November 2022. BlackRock’s fundamental equities team estimates that the energy demanded to train and run AI models could top 1000 terawatt hours of incremental demand by 2030 (a quarter of the U.S. yearly electricity consumption!) — a forecast that has pulled utilities 15% higher year-to-date.2 Adding to the constructive outlook for the sector are benign valuations: unlike most of the S&P 500, multiples for the sector are right in line with their historic average. Meanwhile, the tech sector has been trading around 31x P/E, much higher than its 10-year average of 23x.3

Still, despite the AI buzz, ETF flows into utilities are relatively dim. As markets priced in less interest rate cuts for 2024, investor optimism for the rate-sensitive sector has been dwindled. Utility ETFs have shed over $1.6bn in net assets so far this year.4 While these outflows come on the heels of a deeply negative 2023, positive returns in the underlying stocks paint a story of divergence — sentiment belies sector strength.

Figure 3: Subdued enthusiasm for utility funds

Line chart showing year-to-date index performance for utilities and S&P 500, and cumulative flow for utilities ETFs.

Source: BlackRock, Bloomberg, Markit. ETF groupings determined by Markit. Utilities represented by SPTR5UTL Index. S&P 500 represented by SPX Index. As of June 4, 2024.

Chart description: Line chart showing year-to-date index performance for utilities and S&P 500, and cumulative flow for utilities ETFs.


FEATURED FUNDS

JAPAN: CAUSE AND FX

After starting the year with a meaningful rally and strong inflows, Japanese ETFs are in outflow mode. Since the beginning of 2023, Japanese equities have gained as much as 52% on the back of continued investor interest due to the return of economic growth and supportive governance policies, resulting in a steady stream of monthly inflows into Japan ETFs.5

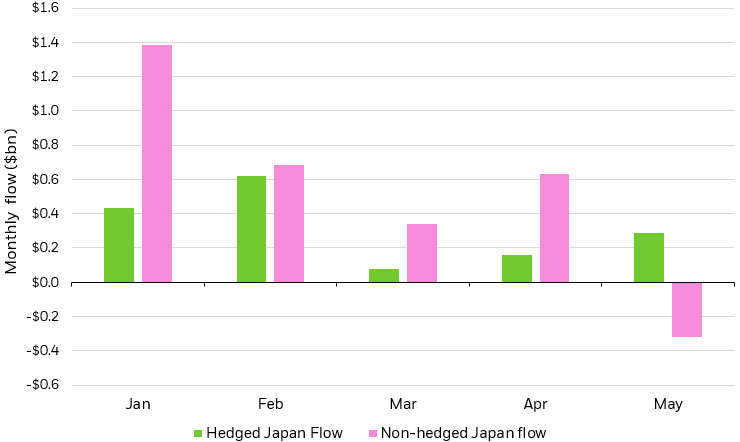
More recently, however, investors have opted to take profit on double-digit gains. For the first time this year, Japanese ETFs have lost assets. Outflows have been led by non-currency hedged funds, which have sharply lagged behind their currency hedged peers this year as the yen reached decades-low levels compared to the USD.6

Un-hedged Japan ETFs lost $315mn in May, marking a turn from the $3bn of inflows added between January and April. Notably, hedged Japanese ETFs remained asset gatherers in May, adding $253mn7 as investors take a more nuanced view on Japan exposure. We remain constructive on Japan over a medium term horizon.

Figure 4: Investors take profit from non-currency hedged Japan country ETFs

Year-to-date monthly flows into hedged and non-hedged Japan ETFs.

Source: BlackRock, Bloomberg. As of June 4, 2024.

Chart description: Year-to-date monthly flows into hedged and non-hedged Japan ETFs.


FEATURED FUNDS

Kristy Akullian, CFA

Kristy Akullian, CFA

Senior member of the iShares Investment Strategy team

Nick Morales

Investment Strategy

Contributor

Jon Angel

Investment Strategy

Contributor

Faye Witherall

Investment Strategy

Contributor

FUND FINDER

You can use BlackRock’s Fund Finder tool to explore the entire universe of U.S. listed ETFs. The tool provides advanced ETF screening and monitoring capabilities to help investors identify which funds may help achieve their goals. Soon you will also be able to view ETF flows data in the tool.