Fed outlook 2025: Key insights for fixed income investors

KEY TAKEAWAYS

  • We believe the most likely path is for the Fed to bring rates down to around 4% in the first half of 2025, and then pause.
  • Fed policy in 2025 will depend on economic data. Key metrics to watch include inflation and the labor market.
  • Given the expected path of Fed policy, we see opportunities for investors in the very front end of the curve, managing interest rate risk with bond laddering and seeking higher income outside of core bonds.

WHAT’S THE OUTLOOK FOR FED POLICY IN 2025?

At its final meeting of 2024, the Federal Reserve cut interest rates by 25 basis points; the Fed has now cut rates by 100 basis points since September 2024.1

So, what may be in store for Fed policy in 2025? And how can investors use bond ETFs to position fixed income portfolios to potentially benefit from the Fed’s expected path? Read on to find out.

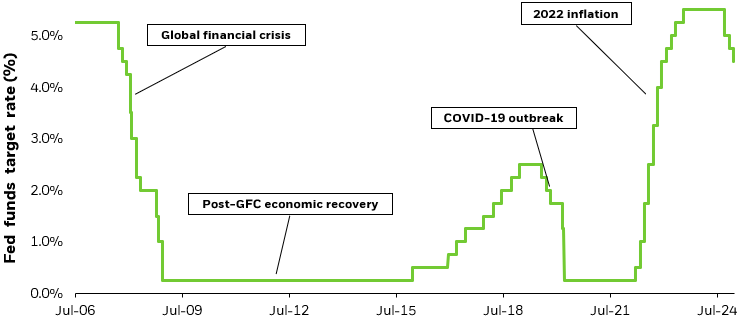
Figure 1: Federal funds rate: A brief history

Line chart depicting the Federal Funds Target Rate over time.

Source: Bloomberg and US Federal Reserve using the Federal Funds Rate – upper bound from July 2006 to December 2024.

Chart description: Line chart depicting the Federal Funds Target Rate over time.


WHAT COULD THE FED FUNDS RATE BE IN 2025 – AND BEYOND?

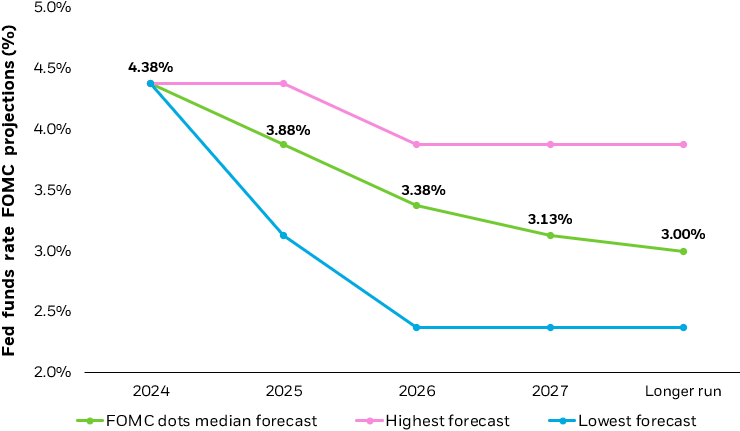
One of the best ways to get insight into how the U.S. central bank views the economy is the Summary of Economic Projections (SEP), which was first released in 2012. This data pack includes the so-called Dot Plot, which incorporates each Fed governor’s expectation for the fed funds rate over the next few years. The Dot Plot indicates the governors’ expectations for 50 basis points of rate cuts in 2025, which would bring the fed fund rate to a range of 3.75% to 4%.2

The SEP also includes long-term forecasts from Fed governors, which vary widely across the committee. The highest, or most “hawkish” estimates call for a longer run policy rate as high as 3.9%, while the lower, more “dovish” governors expect that rate to be around 2.4%. (See Figure 2)

Figure 2: December 2024 “Dot Plot”

Line chart displaying the FOMC "Dot Plot" containing median and lowest forecasts for the target Fed Funds Rate.

Source: US Federal Reserve Summary of Economic Projections as of 12/18/2024.

Chart description: Line chart displaying the FOMC "Dot Plot," which contains the highest, median and lowest forecasts for the target Fed Funds Rate.


Looking out into 2025, we believe the most likely path is for the Fed to bring rates down to around 4% in the coming meetings, and then pause, depending on how the inflation and employment data evolves.

Why is that our base case for 2025? As of November 2024, the U.S. Core Personal Consumption Expenditures (PCE) Price Index was up 2.8% on an annualized basis.3 While that’s down from a rate of 3.4% a year prior, it’s still above the Fed’s stated 2% target.

“We’ve made a great deal of progress” in lowering inflation toward the 2% target, but year-over-year inflation readings are “moving sideways,” Federal Reserve Chairman Jay Powell said in a press conference following the FOMC’s Dec. 18 meeting.4 Barring “further progress on bringing inflation down” it is “appropriate for [the Fed] to move more cautiously” with additional rate cuts.

The BlackRock Investment Institute, meanwhile, foresees “persistent inflation pressures fueled by rising geopolitical fragmentation, plus big spending on the AI buildout and the low-carbon transition.”5 (Read more in BII’s 2025 Investment Outlook)

Combined with America’s rising debt and deficits, that macroeconomic backdrop suggests long-term Treasury yields will likely remain ‘higher for longer’ as investors demand higher compensation for risk.

How far and fast the Fed will cut in 2025 — and if they move rates at all — will be dependent on economic data, barring exogenous shocks like the COVID-19 pandemic. Fed Chairman Powell has repeatedly stressed the Fed is “data dependent” in its decision-making, with a stated long-term inflation target of 2%.6

Our outlook for Fed policy is based on expectations for the U.S. economy to slow slightly but remain in expansion — combined with our understanding of the Fed’s dual mandate.

2025 FOMC meeting schedule⁷

Caption:

Table displaying the 2025 FOMC schedule of meeting dates.

First quarterSecond quarterThird quarterFourth quarter
January 29May 7July 30October 29
March 19*June 18*September 17*December 10*

* Summary of Economic Projects released

WHAT IS THE FED’S DUAL MANDATE?

The Fed’s so-called dual mandate is to keep prices stable, meaning inflation is low and predictable, and foster “maximum” employment, meaning most workers can get a job if they want one.8 These goals may occasionally come in conflict with each other. If monetary policy is too restrictive in an effort to subdue inflation, it may curb economic growth and lead to job losses.

The Fed’s primary goal is to monitor economic data and fine tune interest rates using a combination of tools. The main tool is setting the fed funds rate, which is the rate that banks can borrow money overnight from the central bank. Since the Global Financial Crisis, the Fed has also increased its use of its balance sheet — the ability to hold U.S. Treasury, agency debt and mortgage-backed securities (MBS) — as a means of governing the supply and demand for longer-term interest rates, which generally fall outside the scope of its fed funds rate.

By buying bonds, the Fed aims to lower long-term interest rates, making borrowing cheaper and stimulating economic activity. Conversely, reducing its holdings through bonds sales or letting bonds mature can exert upward pressure on interest rates, tightening monetary conditions.

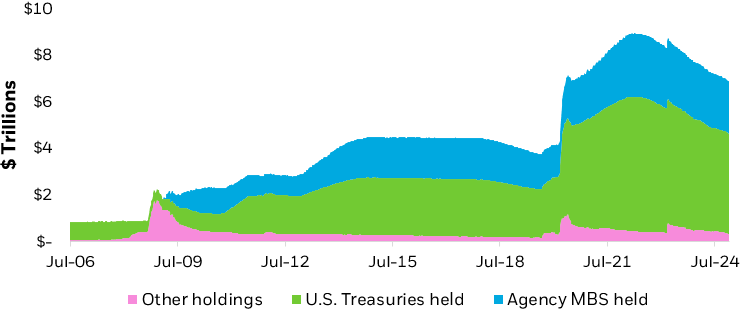
The balance sheet was increased through bond purchases during the COVID-19 pandemic. In May 2022, the FOMC announced that it would begin reducing the size of the balance sheet. In May 2024, the committee announced that it was slowing the pace of the reduction from $60 billion to $25 billion for U.S. Treasuries and maintain the MBS reduction at $35 billion per month. The Fed is accomplishing this by letting bonds mature and not selling into the market. From May 2022 to November 2024, the Fed’s balance sheet declined by $2.0 trillion, from $8.9 trillion to $6.9 trillion.

Figure 3: Composition of the US Federal Reserve’s balance sheet

Area chart displaying the Federal Reserve's balance sheet in three categories.

Source: U.S. Federal Reserve as of Dec. 6, 2024. “Other holdings” include various types of assets such as loans, foreign currency holdings and repurchase agreements.

Chart description: Area chart displaying the Federal Reserve's balance sheet in three categories: U.S. Treasuries, Agency mortgage-backed securities (MBS) and other holdings.


iSHARES BOND ETFs: A TEAM FOR ALL SEASONS

Regardless of the path of Fed policy in 2025, here are some ways investors can use bond ETFs to position their portfolios:

  • Put cash to work: If overnight interest rates stay higher for longer, investors could consider allocating to ultrashort duration or floating rate exposures via SGOV or FLOT.
  • Build bond ladders: Bond ladders hold an equal weight to each calendar year and can allow investors to lock in income before interest rates fall.
  • Seek higher income: Potentially boost fixed income returns with higher yielding bonds, such as high yield, emerging markets, bank loans and CLOs (USHY, EMB, BINC or CLOA).

In sum, investors can use bond ETFs to manage their portfolios regardless of the rate environment. Here is a summary of five interest rate scenarios and potential strategies for managing bond portfolios with iShares bond ETFs:

Using iShares to navigate changing interest rate environments

Caption:

Table showing different interest rate scenarios with potential strategies and iShares ETFs to navigate each scenario.

Interest rate
scenario
Potential
strategies
iShares
bond ETFs
Rate cut


★ Current environment
  • Reduce exposure to floating rate bonds in favor of fixed rate

  • Select higher quality fixed income, which may benefit from a flight to quality
AGG iShares Core U.S. Aggregate Bond ETF
GOVT iShares U.S. Treasury Bond ETF
SHY iShares 1-3 Year Treasury Bond ETF
Longer-term rates fall quickly


  • Add or maintain exposure to longer-term (10+ year) bonds to increase interest rate risk

  • Select higher quality fixed income, which may benefit from a flight to quality*
TLT iShares 20+ Year Treasury Bond ETF
GOVZ iShares 25+ Year Treasury STRIPS Bond ETF
IGLB iShares 10+ Year Investment Grade Corporate Bond ETF
Pause or rates unchanged


  • Add core bonds to get back to target bond allocations

  • Seek higher income

  • Seek relative value on the yield curve
AGG iShares Core U.S. Aggregate Bond ETF
IEI iShares 3-7 Year Treasury Bond ETF
BINC iShares Flexible Income Active ETF
Longer-term rates rise quickly


  • Seek to hedge against interest rate risk when long-term rates rise

  • Maintain exposure to credit risk

  • Move to short maturities or floating rate bonds
HYGH iShares Interest Rate Hedged High Yield Bond ETF
AGRH iShares Interest Rate Hedged U.S. Aggregate Bond ETF
LQDH iShares Interest Rate Hedged Corporate Bond ETF
IGBH iShares Interest Rate Hedged Long-Term Corporate Bond ETF
Rate hike


  • Move to short maturities or floating rate bonds

  • Allocate to credit risk over interest rate risk
TFLO iShares Treasury Floating Rate Bond ETF
FLOT iShares Floating Rate Bond ETF
NEAR iShares Short Duration Bond Active ETF

For illustrative purposes only.


* A “flight to quality” refers to investors’ allocating assets from riskier assets to assets seen as safer and higher in quality. 

Photo: Karen Veraa-Perry, CFA

Karen Veraa-Perry, CFA

Head of U.S. iShares Fixed Income Strategy

Aaron Task

Content Specialist

Contributor

Tom Fickinger

Fixed Income Strategy

Contributor