Flow & Tell with iShares – Summer 2023 standout ETF flows

ROUNDING UP SUMMER FLOWS: THE FALL OF H1 LEADERSHIP

The slow summer months were anything but, with a backup in yields, a cooling of equity enthusiasm, and stronger than expected economic data in the U.S. that kept traders relatively active even in the dog days of summer. Investor preferences shifted with the weather – exhibiting a preference for more diversified equity exposures away from H1 winners, and a pronounced flip from long to short duration demand in fixed income. Higher real yields squashed gold bugs, and commodities more broadly experienced sharp outflows, even as energy prices rallied.

THEMES OF THE MONTH

Mag 493?

Investors rebalance away from H1’s narrow leadership.

The duration dance

Short duration exposures reign as favored fixed income allocations.

The real deal

Higher real yields deliver outflows across commodity funds.

AUGUST ETF FLOWS

August ETF heat map

August ETF flows compared with index performance

Scatter plot showing the relationship between index performance and ETF sub-asset class flows for August 2023.

Source: BlackRock, Bloomberg, chart by iShares Investment Strategy. As of August 30, 2023. Flows normalized by AUM as of of July 31, 2023.


Index performance is for illustrative purposes only. Index performance does not reflect any management fees, transaction costs or expenses. Indexes are unmanaged and one cannot invest directly in an index. Past performance does not guarantee future results.


Index performance is measured by the following indexes: EM  Equity: MSCI Emerging Markets IMI Index; Gold: ICE LBMA Gold Price Index; U.S. Treasury: ICE BofA 10-Year U.S. Treasury Index; Communication Services: S&P 500 GICS Level 1 Communication Services Sector Index; Utilities: S&P 500 GICS Level 1 Utilities Sector Index; HY Credit: iBoxx USD High Yield Index; Commodities: S&P GSCI Index; Information Technology: S&P 500 GICS Level 1 Information Technology Sector Index; Consumer Staples: S&P 500 GICS Level 1 Consumer Staples Sector Index; Health Care: S&P 500 GICS Level 1 Health Care Sector Index; Financials: S&P 500 GICS Level 1 Financials Sector Index; Industrials: S&P 500 GICS Level 1 Industrials Sectors Index; Energy: S&P 500 GICS Level 1 Energy Sectors Index. Coloring is based on quadrants: quadrant I: green; quadrant II: yellow; quadrant III: pink; quadrant IV: purple.

Chart description: Scatter plot showing the relationship between index performance and ETF sub-asset class flows for August 2023. Chart shows some sub-asset classes, such Information Technology and Growth having positive ETF flows but negative index performance. Other sectors, like Financials, saw both negative index performance and outflows in August.


MAG 493?

The stock market closed its best start of the year through July in 26 years, a feat led by info tech’s 46% return on the year as waning inflation and mounting AI optimism evoked newfound bullishness.1 August took the air out of the trade, however, as the rally’s breakneck pace stalled with equity flows rebalancing away from H1 leaders.

The high-flying “Magnificent 7” are emblematic of this shift, with the FANG+ Index down over 3% in August after averaging a magnificent 10% monthly gain in the first half of the year.2 Flows followed performance, with investors flocking to equal weighted exposures in search of a catch-up trade away from the year’s narrow leadership — indeed, EUSA (iShares MSCI USA Equal Weighted ETF) posted its fifth largest month of inflows in the past 5 years in July.3

This broader story unfolded across other exposures — flows rotated from growth to value in August, and outflows from defensive sectors financed inflows to cyclical funds. The positioning swap underscores an expected change in leadership as we step into the back half of the year, or at the very least, profit taking from the monthslong rally.

Growth to value: rotation in leadership

Bar chart depicting ETF flows for growth and value exposures.

Source: BlackRock, Bloomberg, Markit, chart by iShares Investment Strategy. ETF groupings determined by BlackRock, Markit. As of August 29, 2023.

Chart description: Bar chart depicting ETF flows for growth and value exposures. The chart shows outflows from growth in August, while value adds inflows.


THE DURATION DANCE

While investors continue to flock to high quality fixed income assets while awaiting the delayed effects of the Fed’s rate hiking campaign, a shift in duration preferences underscored August inflows.

At the start of the summer, the MOVE Index, the Treasury market’s measure of volatility, sank from yearly highs of over 130 to a monthly average of about 114 in both June and July. The decline in volatility alongside moderating inflation data led investors to step into the curve as they embraced the soft-landing narrative. Long-duration exposures emerged as the winner: long-end U.S. government ETFs posted their largest monthly inflow in over a year, gathering over $5.5bn.4

However, the duration extension proved to be short lived as bond yields surged in August. The 10-year Treasury note climbed to 13-year highs, while the 5-year yield returned over 5% — moves that sent investors to the front-end of the curve en masse. The backup in yields hailed from a confluence of factors: the BOJ relaxed their yield controls, Fitch downgraded the U.S.’s credit ranking, and economic data signaled higher growth expectations, a trifecta that spooked investors out of longer duration positions on fears of longer-term rates moving higher.

Short term Treasury funds added over $4.0bn in net inflows in August, a reversal from the four consecutive months of net outflows. Longer dated Treasury products fared an opposite fate, currently on track for their first month of outflows since January 2022.5

YTD U.S. government flows

Bar chart depicting ETF Treasury flows from January 2023 to August 2023, across durations.

Source: BlackRock, Bloomberg, Markit, chart by iShares Investment Strategy. ETF groupings determined by Markit. As of August 29, 2023.

Chart Description: Bar chart depicting ETF Treasury flows from January 2023 to August 2023, across durations.


THE REAL DEAL

Many topics have been the fad of the summer — Barbie, Oppenheimer, T-Swift and Beyonce. But in the financial world, we have been playing close attention to rising real rates that have reached levels unseen since 2008 (talk about a comeback).6 Real rates are nominal interest rates adjusted for inflation, meaning the rate of return after subtracting the amount you lose from inflation.

Real yields have risen for a few reasons. Notably, U.S. bond yields climbed on the back of strong growth surprising to the upside, as robust economic prints from retail sales, durable goods, housing starts and personal income underscore resilience, not recession. This rosier growth data boosted yields while supporting our expectation that the Fed will keep interest rates higher for longer. Couple this with a meaningful deceleration in inflation — moderating inflation and higher nominal rates result in higher real yields.

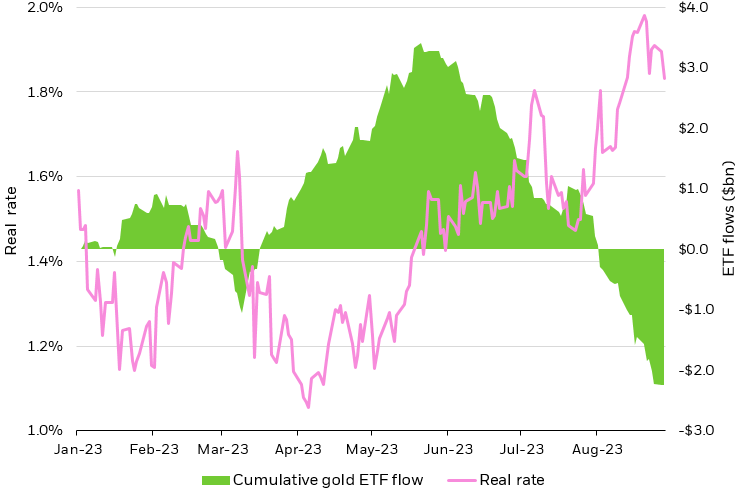
While elevated real rates impact ETF flows in several pockets of the market, gold is drastic example. Gold and real rates often move inversely, as increasing real yields can make yield bearing assets, like bonds, a more attractive investment against non-yielding assets like gold. Since July, gold ETFs have shed $3.8bn. The trend is evident in the broader commodity suite, too — silver, crude, and broad market commodity funds have all been in negative territory since the start of July with outflows across the board.7

Gold demand in different eras: no longer the golden child

Line and area chart showing U.S. real rates increasing in August, while gold ETFs experience outflows.

Source: BlackRock, Bloomberg. As of August 29, 2023. Chart by iShares Investment Strategy. Real rates represented by US Generic Govt TII 10 Yr (USGGT10Y Index). ETF grouping determined by Markit. Flows rebased to 0 as of December 31, 2022.

Chart description: Line and area chart showing U.S. real rates increasing in August, while gold ETFs experience outflows.


FEATURED FUNDS

FEATURED FUNDS

FEATURED FUNDS

The iShares Gold Trust and iShares Gold Trust Micro are not an investment company registered under the Investment Company Act of 1940, and therefore are not subject to the same regulatory requirements as mutual funds or ETFs registered under the Investment Company Act of 1940. Investments in these ETF's are speculative and involves a high degree of risk. Visit www.iShares.com for a prospectus, which includes investment objectives, risks, fees, expenses and other information that you should read and consider carefully before Investing.
Kristy Akullian, CFA

Kristy Akullian, CFA

Senior member of the iShares Investment Strategy team

Jon Angel

Investment Strategy

Contributor

Faye Witherall

Investment Strategy

Contributor

Berkelee Jimenez

Markets Coverage

Contributor