Updated: June 5, 2024
QUALITY INVESTING 101: THE BASICS AND ITS ROLE IN PORTFOLIOS
Apr 14, 2023 Factors
KEY TAKEAWAYS
- Quality investing targets companies with a consistent track record of strong earnings and stable balance sheets.
- Quality investing has been around for decades and is supported by economic theory and empirical data.
- Quality strategies may use a combination of metrics such as profitability (ROE), earnings stability, and low leverage (D/E), to identify firms with strong earnings and stable balance sheets.
WHAT IS QUALITY INVESTING?
Quality investing strategies seek to buy financially healthy companies that have strong earnings and stable balance sheets. Quality is about trying to find companies that are efficient with capital.
Imagine that you’re at the grocery store and looking to buy fruit. You notice today that the organic apples are priced the same as the non-organic apples. Given the current prices, you opt to buy the “higher quality,” organic apples. Think of quality investing in a similar light. Quality investors are looking to get more for their money.
HOW DO WE DEFINE QUALITY INVESTING?
BlackRock takes a multiple metric approach in examining a company’s quality exposure. Specifically, we are looking for firms that are profitable, have low leverage, and demonstrate consistent earnings over time.
BlackRock’s approach to quality investing
| Metric | Objective |
|---|---|
| Return-on-equity (ROE) | Identify Profitable Stocks |
| Debt-to-equity (D/E) | Determine stocks with low leverage |
| Earnings variability | Identify companies with steady growth over time |
Source: BlackRock, MSCI
Let’s review each of these three metrics.
Return-on-Equity (ROE) evaluates a company’s profitability by dividing its net income by its shareholder’s equity, which is a company’s total assets minus its total liabilities. This metric measures a company’s ability to generate profits from shareholders’ investments in the company. A higher ROE typically indicates a more profitable company.
Debt-to-Equity (D/E) measures a company’s financial leverage by comparing its total debt relative to its total equity. A high debt-to-equity ratio can indicate that a company is relying heavily on debt financing, which may be an indication of increased financial risk. A lower D/E ratio may indicate higher quality characteristics as the company may be at lower risk of defaulting on its debt obligations.
Earnings Variability measures a company’s ability to consistently generate stable growth in earnings over time. A company with less variability in earnings may be considered more stable and less risky.
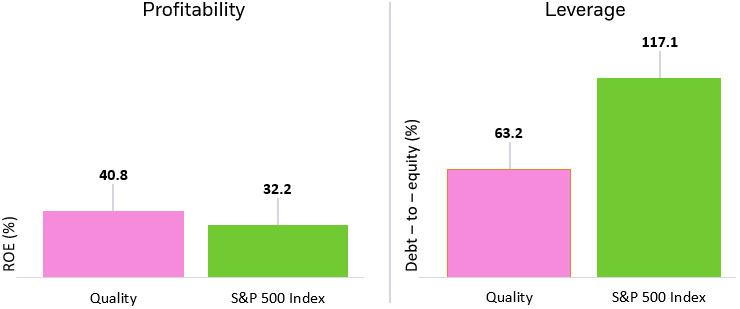
As expected, the quality factor1 has both higher ROE and lower debt-to-equity when compared to the S&P 500 Index.
Quality characteristics

Source: Bloomberg, Morningstar as of as of 3/31/2024. Subject to change. Quality is represented by the MSCI USA Sector Neutral Quality Index. Indexes are unmanaged and one cannot invest directly in an index. Past performance does not guarantee future results.
Chart descriptions: Bar chart on the left that shows return-on-equity for quality (as measured by the MSCI USA Sector Neutral Quality Index) vs the market (as represented by the S&P 500). Data as of 3/31/24. Bar chart on the right that shows leverage for quality (as measured by the MSCI USA Sector Neutral Quality Index) vs the market (as represented by the S&P 500). Data as of 3/31/24.
QUALITY PORTFOLIO CONSTRUCTION
When building a quality portfolio, there are several key decisions on how to construct the strategy. For example: Should there be any constraints on sectors? How should companies be ranked against others?
Sector deviations are an element of risk that we can control, and we believe that it makes the most sense for sectors to be constrained. In other words, sector weightings should be similar to the broad market. This enables quality investors to gain exposure to the highest-quality earnings across all sectors, without making unintended bets on specific sectors.
Additionally, we believe it is prudent to compare quality characteristics of a company relative to its peers in the same sector. Sector comparisons allow companies to be scored on equal footing.
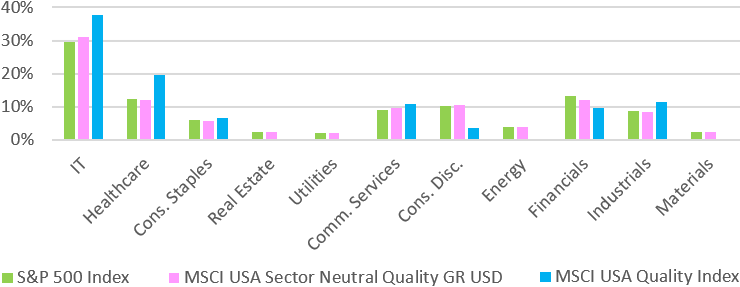
The MSCI USA Sector Neutral Quality Index applies a sector neutral weight to its parent index2 at each rebalance and also scores companies’ vs its peers. As highlighted in the chart below, the MSCI USA Sector Neutral Quality Index has very similar sector allocations to the S&P 500 Index, whereas the MSCI USA Quality Index has significant overweights to tech and healthcare, and underweights to energy, real estate, and utilities.
Sector allocation (%)

Source: Morningstar, as of 3/31/2024. Allocations subject to change.
Chart description: Bar chart that compares the sector allocations between the S&P 500 Index, the MSCI USA Sector Neutral Quality Index, and MSCI USA Quality Index as of 3/31/24.
WHY DOES QUALITY EXIST AND WHY WE DO EXPECT IT TO PERSIST?
We believe quality, like all factors we believe in at BlackRock, has an economic rationale for why it has existed historically, and more importantly, why we expect it to persist going forward.
In quality’s case, it’s about what you pay versus what you get. If two companies have similar relative prices but one has higher quality earnings, the company with higher quality earnings must have a higher expected return. This is a key difference between quality and value investors, who may also be looking to get more for their money, but typically concentrate primarily on the price of the company’s stock.
CONCLUSION
Quality investing is all about identifying financially healthy companies with strong balance sheets. It’s backed by economic data and academic research.3,4
Accessing quality through a low-cost, tax-efficient ETF such as the iShares MSCI USA Quality Factor ETF (Ticker: QUAL), which seeks to track the MSCI USA Sector Neutral Quality Index allow investors to gain exposure to a diversified portfolio of stocks that look strong on multiple quality metrics — profitability, leverage, and earnings variability — and without unintended sector bets.
There can be no assurance that performance will be enhanced or risk will be reduced for funds that seek to provide exposure to certain quantitative investment characteristics ("factors"). Exposure to such investment factors may detract from performance in some market environments, perhaps for extended periods. In such circumstances, a fund may seek to maintain exposure to the targeted investment factors and not adjust to target different factors, which could result in losses.

