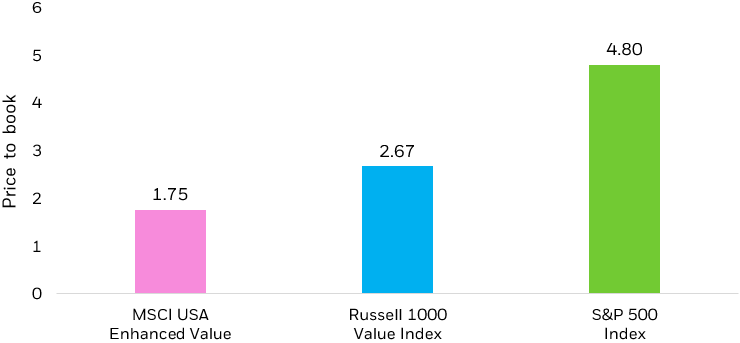
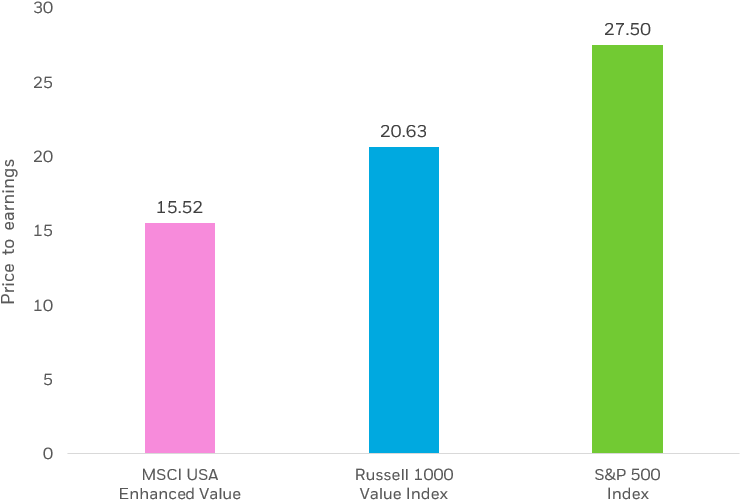
Let’s review each of these three metrics.
Price-to-Book (P/B) takes the price of a single share of stock divided by the company’s book value per share. This metric shows what the market is willing to pay for a single share of a company relative to its assets minus its liabilities. A higher price-to-book ratio relative to peers may indicate that a stock is expensive and should have a lower expected return. On the flipside, a lower relative price-to-book ratio may indicate that the stock is “cheap” and should have a higher expected return. Much of the academic literature on value investing uses P/B as its proxy for value as the metric is consistently available and the denominator, book value, tends to be relatively stable over time.2
Forward-Price-to-Earnings (P/E) looks at the price per share of a stock compared to the 12-month forward earnings expectations of that stock. This metric seeks to evaluate the relative attractiveness of a company on a forward-looking basis. If two companies have the same stock price, but one has higher expected future earnings, the company with the lower forward P/E (higher denominator) may be considered inexpensive and should have the potential for higher future returns. One benefit of using a forward-looking metric in addition to P/B, is that it may help identify “value traps.” A value trap is a stock that is priced cheap for a reason.
Enterprise Value to Cash Flow from Operations (EV/CFO) is an additional metric that provides a differentiated view of a company. Enterprise Value looks at the entire firm, not just equity, by adding a company’s total debt to its market value and then subtracting out its cash. Cash generated from the core business of a company (CFO) tends to be more sustainable than earnings generated from other business activities.
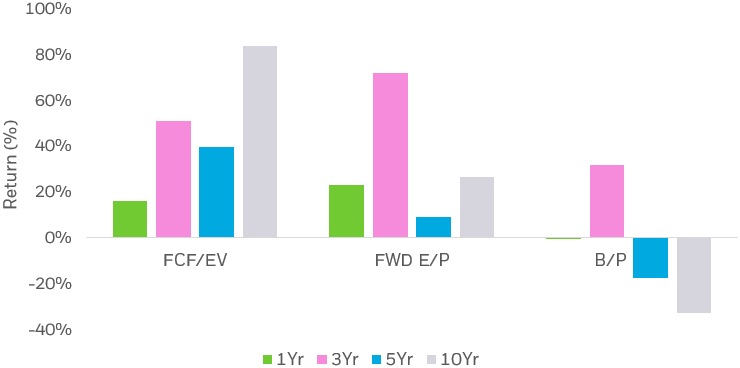
Depending on the metric used to evaluate a company’s value characteristics, an investor can have a significantly different experience. As shown in the chart below, there has been a wide dispersion in returns between different metrics.


