Equity

MAXJ

iShares Large Cap Max Buffer Jun ETF ACTIVE

Visit Portfolio Tool

Overview

Loading

Performance

Performance

Growth of Hypothetical $10,000

View full chart

Distributions

This fund does not have any distributions.

Premium/Discount

Performance data is not currently available
The performance quoted represents past performance and does not guarantee future results. Investment return and principal value of an investment will fluctuate so that an investor's shares, when sold or redeemed, may be worth more or less than the original cost. Current performance may be lower or higher than the performance quoted.
Screen of

BUFFER COMPARISON CHART

Buffer ETFs target different levels of downside protection to help you balance risk and return potential.

Key Facts

Key Facts

Net Assets of Fund
as of Jul 16, 2024
$42,746,139
Exchange
Cboe BZX formerly known as BATS
Benchmark Index
S&P 500 Index
Distribution Frequency
Annual
CUSIP
46438G612
30 Day Avg. Volume
as of Jul 16, 2024
199,618.00
Daily Volume
as of Jul 16, 2024
134,307.00
Fund Inception
Jun 28, 2024
Asset Class
Equity
Shares Outstanding
as of Jul 16, 2024
1,680,000
Premium/Discount
as of Jul 16, 2024
0.02
Closing Price
as of Jul 16, 2024
25.45
30 Day Median Bid/Ask Spread
as of Jul 16, 2024
0.08%

Strategy Characteristics

Strategy Characteristics

The Fund employs an option strategy that seeks to track the returns of the Underlying ETF while providing an approximate downside buffer (the “Buffer”) in exchange for an approximate cap (the “Cap”) on upside potential. This Buffer may help reduce volatility and mitigate the effects of a decline in value of the fund to a set range of potential losses. The table below provides an indication of the Buffer and Cap levels as of previous day’s market close.
Starting Payoff Values
Starting Cap
10.64%
Starting Buffer
99.50%
Starting Downside Before Buffer
-0.50%
Current Payoff Values
Remaining Cap
as of Jul 16, 2024
8.77%
Return in Reference Asset to Realize Cap
as of Jul 16, 2024
7.08%
Remaining Buffer
as of Jul 16, 2024
97.82%
Downside Before Buffer
as of Jul 16, 2024
-2.18%
Reference Asset Values
Reference Asset Value
as of Jul 16, 2024
$567.96
Cap Reference Asset Value
as of Jul 16, 2024
$608.19
Buffer Start Reference Asset Value
as of Jul 16, 2024
$547.23
Buffer End Reference Asset Value
as of Jul 16, 2024
$0.00

The Fund’s position relative to the Cap and Buffer should be considered before investing in the Fund. Investor experiences may differ.


What is the hedge period and how can it affect investor experience?

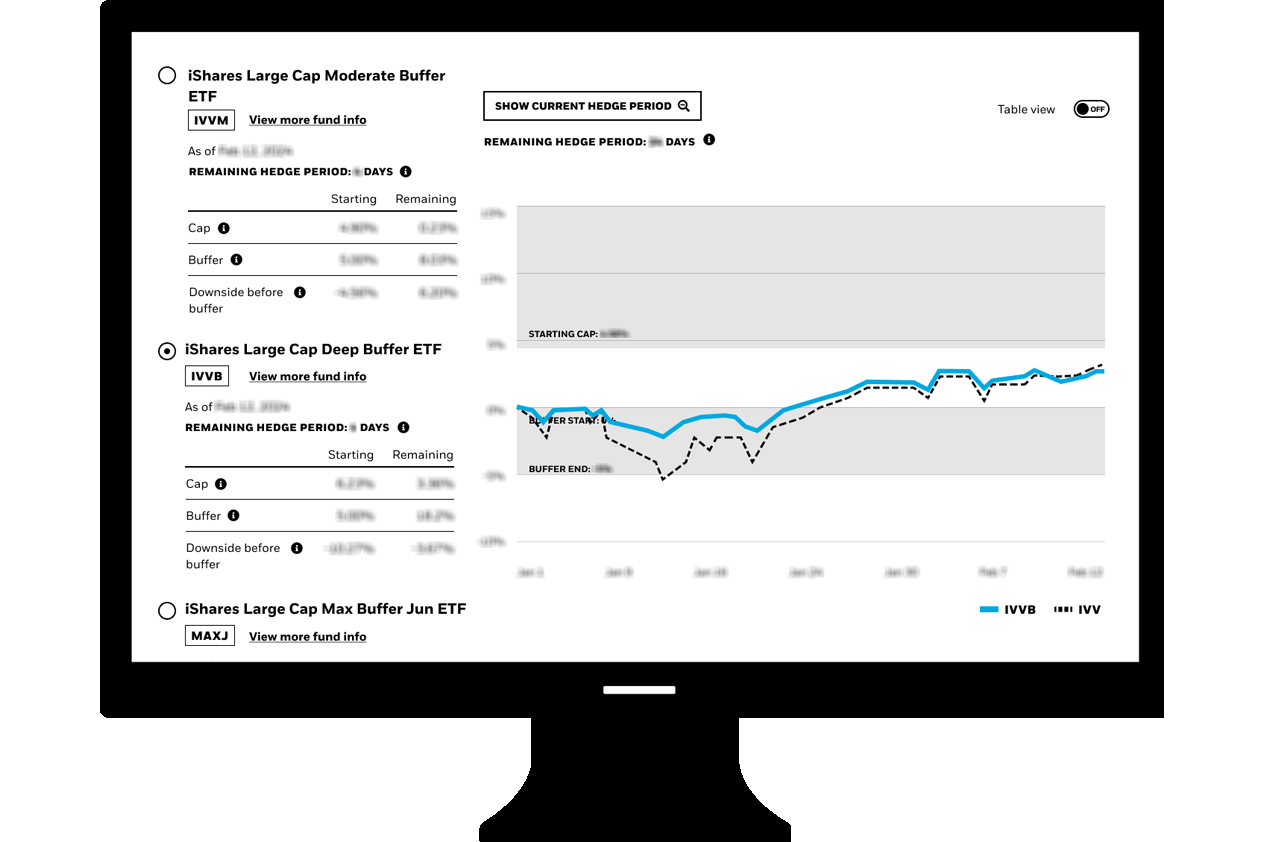
The Buffer and Cap apply to Fund shares held over the hedge period. An investor that purchases Fund shares after the beginning of a hedge period, or sells Fund shares before the end of a hedge period, may not fully realize the Buffer or Cap for the hedge period and may be exposed to greater risk of loss. For example, if an investor purchases Fund shares during a hedge period at a time when the Underlying ETF’s share price has decreased from its price at the beginning of the hedge period, the investor’s Buffer may be decreased. Conversely, if an investor purchases Fund shares during a hedge period at a time when the Underlying ETF’s share price has increased from its price at the beginning of the hedge period, the investor’s upside potential may be reduced and the investor may experience losses prior to reaching the downside protection offered by the Buffer.

Strategy Characteristics are meant to provide investors with additional metrics on the options strategy within the Fund. They are provided for transparency and illustrative purposes only, are not representative of a specific investment outcome and may not represent current value. The Cap and Buffer may vary from what is shown in the table above. All payoff figures, including the Buffer and Cap, are in reference to the option maturity date and are not guaranteed. All figures shown are net of fees.

Strategy Characteristics

Portfolio Characteristics

Portfolio Characteristics

Equity Beta (3y)
as of -
-
12m Trailing Yield
as of -
-
P/E Ratio
as of Jul 16, 2024
27.99
Unsubsidized 30-Day SEC Yield
as of Jun 30, 2024
0.00%
30 Day SEC Yield
as of Jun 30, 2024
0.00%
Standard Deviation (3y)
as of -
-
P/B Ratio
as of Jul 16, 2024
4.88
This information must be preceded or accompanied by a current prospectus. For standardized performance, please see the Performance section above.

Sustainability Characteristics

Sustainability Characteristics

To be included in MSCI ESG Fund Ratings, 65% (or 50% for bond funds and money market funds) of the fund’s gross weight must come from securities with ESG coverage by MSCI ESG Research (certain cash positions and other asset types deemed not relevant for ESG analysis by MSCI are removed prior to calculating a fund’s gross weight; the absolute values of short positions are included but treated as uncovered), the fund’s holdings date must be less than one year old, and the fund must have at least ten securities. MSCI Ratings are currently unavailable for this fund.

Business Involvement

Business Involvement

Business Involvement metrics can help investors gain a more comprehensive view of specific activities in which a fund may be exposed through its investments.


Business Involvement metrics are not indicative of a fund’s investment objective, and, unless otherwise stated in fund documentation and included within a fund’s investment objective, do not change a fund’s investment objective or constrain the fund’s investable universe. For more information regarding a fund's investment strategy, please see the fund's prospectus.


Review the MSCI methodology behind the Business Involvement metrics, using links below.

MSCI - Controversial Weapons
as of Jul 16, 2024
0.66%
MSCI - Nuclear Weapons
as of Jul 16, 2024
0.43%
MSCI - Civilian Firearms
as of Jul 16, 2024
0.00%
MSCI - Tobacco
as of Jul 16, 2024
0.51%
MSCI - UN Global Compact Violators
as of Jul 16, 2024
0.00%
MSCI - Thermal Coal
as of Jul 16, 2024
0.00%
MSCI - Oil Sands
as of Jul 16, 2024
0.00%

Business Involvement Coverage
as of Jul 16, 2024
98.69%
Percentage of Fund not covered
as of Jul 16, 2024
1.31%
BlackRock business involvement exposures as shown above for Thermal Coal and Oil Sands are calculated and reported for companies that generate more than 5% of revenue from thermal coal or oil sands as defined by MSCI ESG Research. For the exposure to companies that generate any revenue from thermal coal or oil sands (at a 0% revenue threshold), as defined by MSCI ESG Research, it is as follows: Thermal Coal 0.00% and for Oil Sands 1.92%.

Business Involvement metrics are calculated by BlackRock using data from MSCI ESG Research which provides a profile of each company’s specific business involvement. BlackRock leverages this data to provide a summed up view across holdings and translates it to a fund's market value exposure to the listed Business Involvement areas above.


Business Involvement metrics are designed only to identify companies where MSCI has conducted research and identified as having involvement in the covered activity. As a result, it is possible there is additional involvement in these covered activities where MSCI does not have coverage. This information should not be used to produce comprehensive lists of companies without involvement. Business Involvement metrics are only displayed if at least 1% of the fund’s gross weight includes securities covered by MSCI ESG Research.

Fees

Fees

as of current prospectus
Management Fee 0.50%
Acquired Fund Fees and Expenses 0.03%
Other Expenses 0.00%
Expense Ratio 0.53%
Fee Waivers 0.03%
Net Expense Ratio 0.50%

The amounts shown above are as of the current prospectus, but may not include extraordinary expenses incurred by the Fund over the past fiscal year. Amounts are rounded to the nearest basis point, which in some cases may be "0.00".

Holdings

Holdings

Ticker Name Type Sector Asset Class Market Value Weight (%) Notional Value Shares Par Value CUSIP ISIN SEDOL Price Location Exchange Currency Duration FX Rate Maturity Coupon (%) Accrual Date Effective Date Strike price
Holdings are subject to change.


The values shown for “market value,” “weight,” and “notional value” (the “calculated values”) are based off of a price provided by a third-party pricing vendor for the portfolio holding and do not reflect the impact of systematic fair valuation (“the vendor price”). The vendor price is not necessarily the price at which the Fund values the portfolio holding for the purposes of determining its net asset value (the “valuation price”). Holdings data shown reflects the investment book of record, which may differ from the accounting book of record used for the purposes of determining the Net Assets of the Fund. Additionally, where applicable, foreign currency exchange rates with respect to the portfolio holdings denominated in non-U.S. currencies for the valuation price will be generally determined as of the close of business on the New York Stock Exchange, whereas for the vendor price will be generally determined as of 4 p.m. London. The calculated values may have been different if the valuation price were to have been used to calculate such values. The vendor price is as of the most recent date for which a price is available and may not necessarily be as of the date shown above.

Please see the “Determination of Net Asset Value” section of each Fund’s prospectus for additional information on the Fund’s valuation policies and procedures.

Screen of

BUFFER COMPARISON CHART

Buffer ETFs target different levels of downside protection to help you balance risk and return potential.

READY TO INVEST?

READY TO INVEST?

There are many ways to access iShares ETFs. Learn how you can add them to your portfolio.

Portfolio Managers

Portfolio Managers

Jennifer Hsui
Jennifer Hsui
Greg Savage
Head of Americas Index Asset Allocation


Paul Whitehead
Paul Whitehead

Literature

Literature