DMAX
iShares Large Cap Max Buffer Dec ETF
-
Fees as stated in the prospectus
Expense Ratio: 0.53%
Net Expense Ratio: 0.50%
Overview

Performance
Performance
Growth of Hypothetical $10,000
Distributions
Premium/Discount
-
Returns
| 1y | 3y | 5y | 10y | Incept. | |
|---|---|---|---|---|---|
|
Total Return (%)
as of Mar 31, 2025 |
- | - | - | - | - |
|
Market Price (%)
as of Mar 31, 2025 |
- | - | - | - | - |
|
Benchmark (%)
as of Mar 31, 2025 |
- | - | - | - | - |
|
After Tax Pre-Liq. (%)
as of Mar 31, 2025 |
- | - | - | - | - |
|
After Tax Post-Liq. (%)
as of Mar 31, 2025 |
- | - | - | - | - |
| YTD | 1m | 3m | 6m | 1y | 3y | 5y | 10y | Incept. | |
|---|---|---|---|---|---|---|---|---|---|
|
Total Return (%)
as of Mar 31, 2025 |
-0.24 | -1.02 | -0.24 | - | - | - | - | - | -0.24 |
|
Market Price (%)
as of Mar 31, 2025 |
-0.20 | -1.03 | -0.20 | - | - | - | - | - | -0.20 |
|
Benchmark (%)
as of Mar 31, 2025 |
-4.27 | -5.63 | -4.27 | - | - | - | - | - | -4.27 |
|
After Tax Pre-Liq. (%)
as of Mar 31, 2025 |
-0.24 | -1.02 | -0.24 | - | - | - | - | - | -0.24 |
|
After Tax Post-Liq. (%)
as of Mar 31, 2025 |
-0.14 | -0.61 | -0.14 | - | - | - | - | - | -0.14 |

INVESTMENT STRATEGIES
BUFFER COMPARISON CHART
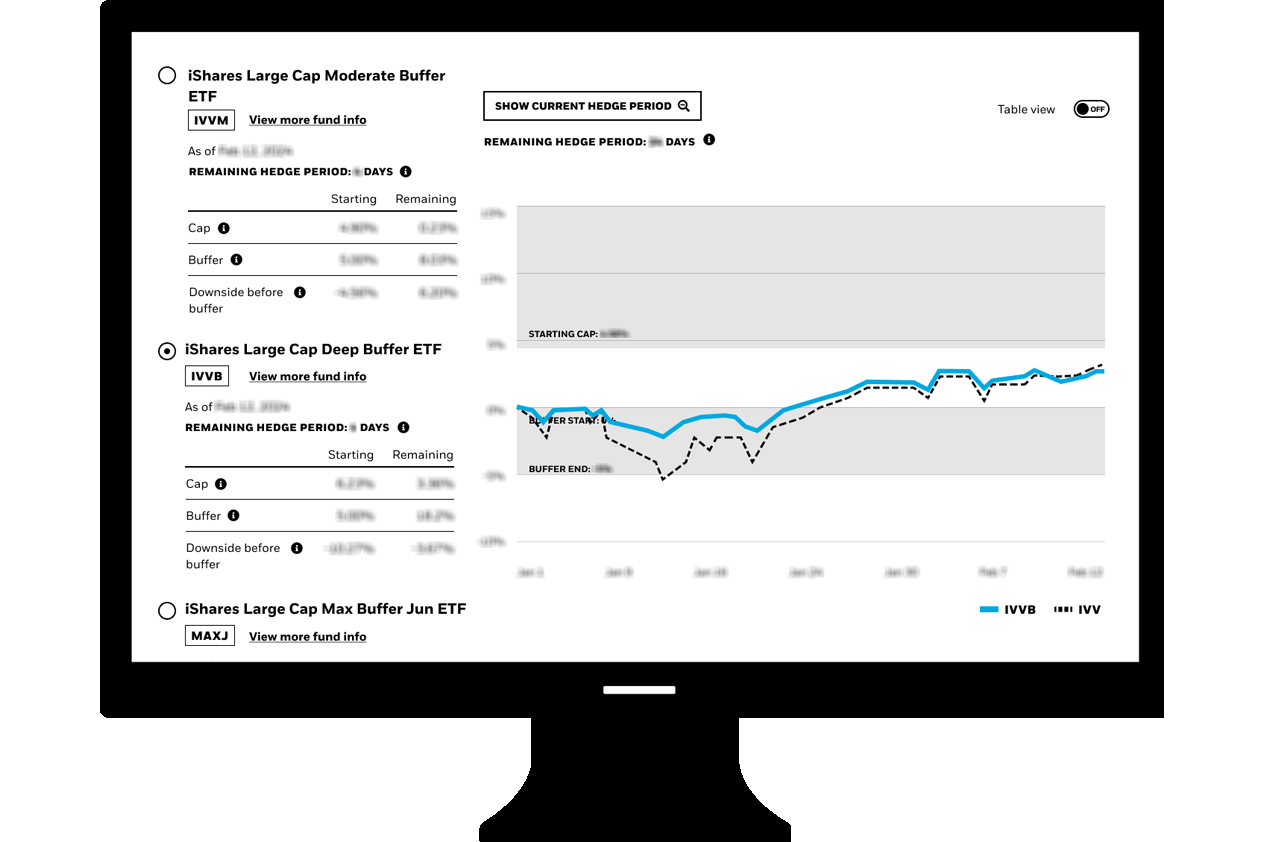
Buffer ETFs target different levels of downside protection to help you balance risk and return potential.
Key Facts
Key Facts
Strategy Characteristics
Strategy Characteristics
| Starting Payoff Values | |
|---|---|
|
Starting Cap
|
7.90% |
|
Starting Buffer
|
99.50% |
|
Starting Downside Before Buffer
|
-0.50% |
|
Hedge Period Start Date
|
Jan 01, 2025 |
|
Hedge Period End Date
|
Dec 31, 2025 |
| Current Payoff Values | |
|---|---|
|
Remaining Hedge Period
as of Apr 15, 2025
|
260 Days |
|
Remaining Cap
as of Apr 15, 2025
|
8.90% |
|
Return in Reference to Realize Remaining Cap
as of Apr 15, 2025
|
18.13% |
|
Remaining Buffer
as of Apr 15, 2025
|
100.43% |
|
Remaining Downside Before Buffer
as of Apr 15, 2025
|
0.00% |
| Reference Asset Values | |
|---|---|
|
Reference Asset
|
IVV |
|
Reference Asset Value
as of Apr 15, 2025
|
$540.19 |
|
Cap Reference Asset Value
as of Apr 15, 2025
|
$638.13 |
|
Buffer Start Reference Asset Value
as of Apr 15, 2025
|
$588.68 |
|
Buffer End Reference Asset Value
as of Apr 15, 2025
|
$0.00 |
Strategy Characteristics
Portfolio Characteristics
Portfolio Characteristics
Fees
Fees
| Management Fee | 0.50% |
| Acquired Fund Fees and Expenses | 0.03% |
| Other Expenses | 0.00% |
| Expense Ratio | 0.53% |
| Fee Waivers | 0.03% |
| Net Expense Ratio | 0.50% |
The amounts shown above are as of the current prospectus, but may not include extraordinary expenses incurred by the Fund over the past fiscal year. Amounts are rounded to the nearest basis point, which in some cases may be "0.00".
Ratings
Holdings
Holdings
The values shown for “market value,” “weight,” and “notional value” (the “calculated values”) are based off of a price provided by a third-party pricing vendor for the portfolio holding and do not reflect the impact of systematic fair valuation (“the vendor price”). The vendor price is not necessarily the price at which the Fund values the portfolio holding for the purposes of determining its net asset value (the “valuation price”). Holdings data shown reflects the investment book of record, which may differ from the accounting book of record used for the purposes of determining the Net Assets of the Fund. Additionally, where applicable, foreign currency exchange rates with respect to the portfolio holdings denominated in non-U.S. currencies for the valuation price will be generally determined as of the close of business on the New York Stock Exchange, whereas for the vendor price will be generally determined as of 4 p.m. London. The calculated values may have been different if the valuation price were to have been used to calculate such values. The vendor price is as of the most recent date for which a price is available and may not necessarily be as of the date shown above.
Please see the “Determination of Net Asset Value” section of each Fund’s prospectus for additional information on the Fund’s valuation policies and procedures.
“Quantity” represents the number of shares, units or contracts of the corresponding security, as applicable per security type.
READY TO INVEST?
READY TO INVEST?
There are many ways to access iShares ETFs. Learn how you can add them to your portfolio.
Portfolio Managers
Portfolio Managers


