SEPTEMBER FLOWS
September saw a string of volatility inducing events across the globe: surprise stimulus out of China, military escalations in the Middle East, and powerful market reactions. Here are the top ETF flow trends of the month:
Oct 08, 2024 Global
September saw a string of volatility inducing events across the globe: surprise stimulus out of China, military escalations in the Middle East, and powerful market reactions. Here are the top ETF flow trends of the month:
Active ETF launches continue to tick higher. September delivered the arrival of 28 new active funds, accounting for a whopping 72% of all newly minted ETFs.1 Active appetite has been widespread, but flow trends show that investors have notably leaned into active management in underperforming segments:
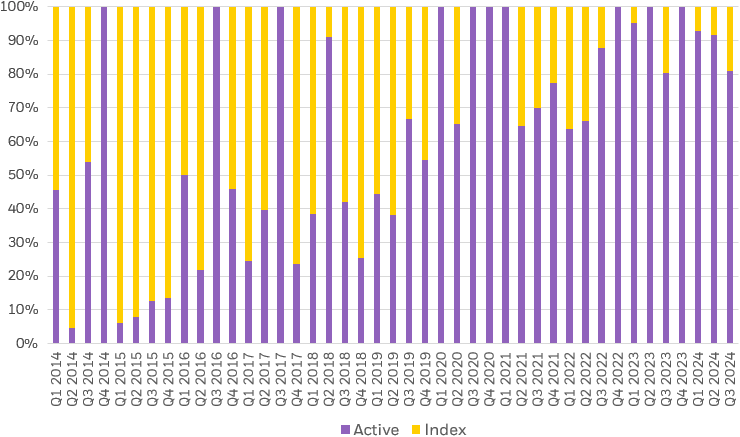
Source: BlackRock, Markit. ETF groupings determined by Markit. As of October 2, 2024.
Chart description: Stacked bar chart depicting percentage of total ETF launches from 2014 to 2024, broken by active and index.
China’s central bank and the Politburo have delivered the most comprehensive stimulus package since the pandemic. Easing of key policy rates and property sector and consumption support are intended to buoy economic growth after a slew of sluggish prints across real estate, industrial production, and consumer confidence.
The market response was rapid and dramatic — the Shanghai Composite Index swelled 21.4% in the five trading days following the announcements while the Shenzhen Component Index gained over 30%, all paired with trading volumes large enough to trigger system glitches.7
The powerful rally was met with powerful flows. China ETFs were on track for a negative September but reversed to add $800mn in three days — by month end, it was the most positive month of flows in over two years. Investors added $1.4bn on the last day of the month alone — a daily flow larger than every other month this year save one.8
Notably, flows into China ETFs did not translate to flows out of EM ex-China strategies. Monthly flows remain robust, signaling that investors continue to opt for granular solutions and trade China separate from broad EM allocations. The pattern holds regardless of positive or negative price action in China — EMXC, iShares MSCI Emerging Markets ex China ETF, hasn’t seen an outflow in almost two years.
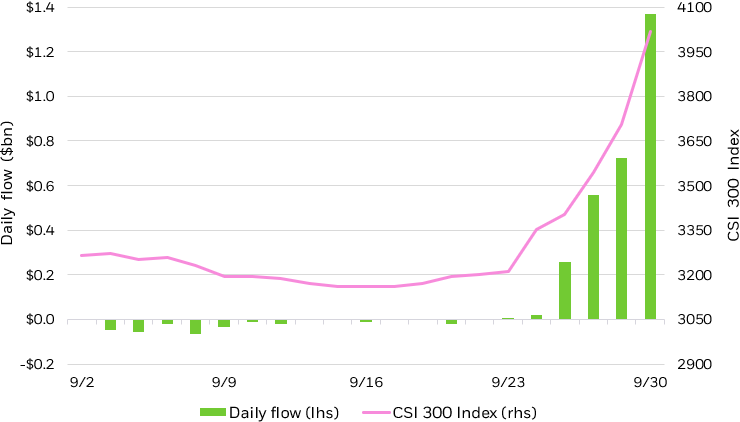
Source: Bloomberg, Markit. As of October 1, 2024. ETP groupings determined by Markit. China performance measured by the CSI 300 Index. Index performance is for illustrative purposes only. Index performance does not reflect any management fees, transaction costs or expenses. Indexes are unmanaged and one cannot invest directly in an index. Past performance does not guarantee future results.
Chart description: Line chart showing CSI 300 Index price performance for the month of September, coupled with a bar chart showing daily flow into China-focused ETFs.
Gold prices steadily climbed on the year, reaching fresh highs even amid a backdrop of weaker interest rate expectations and a strong USD — breaking historical correlations as both factors tend to spell headwinds for gold. Gold now trades above the critical $2,500/oz band, boosted by the beginning of the Fed’s rate cutting cycle and geopolitical volatility in the Middle East. From 2022 to the first half of 2024, central bank demand was the primary driver of gold prices — central banks purchased net 1,037 tonnes and 483 tonnes in 2023 and 1H2024 respectively, sustaining gold prices despite high global interest rates.9 Fed cuts spurred September’s demand, with gold prices rallying over 5% as the start of rate cuts upped the non-yielding asset’s relative attractiveness.10 Gold ETPs gathered $1.47bn in the week of the September FOMC meeting.11
Flows and performance in gold are also tethered to elevated geopolitical volatility overseas. Investors reached for gold, and commodities broadly, in search of a hedge against escalation. All commodity ETPs (which include gold, silver, and copper) added $1.47bn in September, with over 30% of those flows occurring after fighting in the Middle East intensified during the last five trading days of the month.12
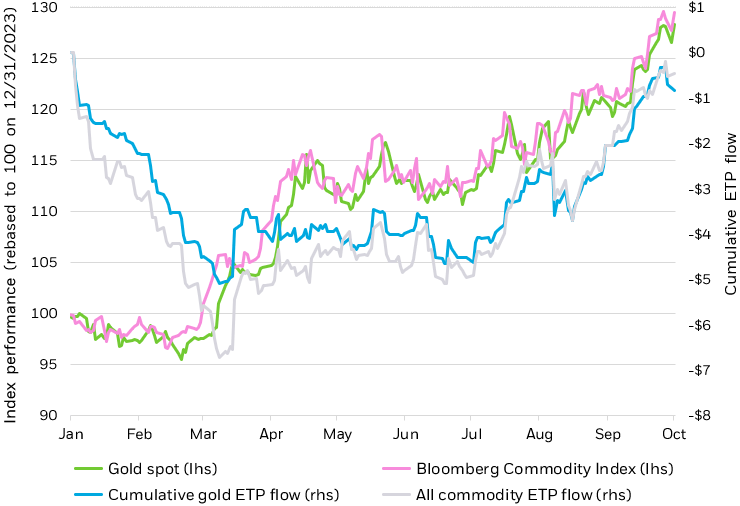
Source: BlackRock, Bloomberg, as of October 01, 2024. Chart by GPS Investment Strategy. Gold performance represented by the Gold United States Dollar Spot Index. ETP groupings determined by Markit, ETPs are U.S-domiciled. Index performance is for illustrative purposes only. Index performance does not reflect any management fees, transaction costs or expenses. Indexes are unmanaged and one cannot invest directly in an index. Past performance does not guarantee future results.
Chart description: Line chart showing gold and commodity flows throughout January to September. The chart depicts gold spot, cumulative gold ETP flows, Bloomberg Commodity Index, and all commodity ETP flows.

You can use BlackRock’s Fund Finder tool to explore the entire universe of U.S. listed ETFs. The tool provides advanced ETF screening and monitoring capabilities to help investors identify which funds may help achieve their goals. Soon you will also be able to view ETF flows data in the tool.
Our Funds
ASSET CLASS
Investment Strategies
EXPLORE NOW
GO FURTHER
Market Insights
EXPLORE NOW
MARKET INSIGHTS
Education
EXPLORE NOW
INVESTING 101
ETF EDUCATION
INVESTMENT STRATEGIES & ASSET CLASSES
PREPARING FOR RETIREMENT
Resources
INSTITUTIONAL INVESTORS
About Us
GET TO KNOW iSHARES
iShares unlocks opportunity across markets to meet the evolving needs of investors. With more than twenty years of experience, iShares continues to drive progress for the financial industry. iShares funds are powered by the expert portfolio and risk management of BlackRock.
© 2025 BlackRock, Inc. All rights reserved.
1 Source: BlackRock, Markit. ETF groupings determined by Markit. As of October 2, 2024.
2 Source: BlackRock, Markit. ETF groupings determined by Markit. As of October 2, 2024.
3 Source: Bloomberg. Small caps represented by Russell 2000 Index; large cap equities represented by S&P 500 Index. As of October 2, 2024.
4 Source: BlackRock, Markit. ETF groupings determined by Market. As of October 2, 2024.
5 Source: Bloomberg. EM equity performance represented by MSCI Emerging Markets Index; developed markets represented by MSCI Developed Markets Index. As of October 2, 2024.
6 Source: BlackRock, Markit. ETF groupings determined by Markit. As of October 2, 2024.
7 Source: Bloomberg. As of October 2, 2024.
8 Source: Bloomberg, Markit. ETF groupings determined by Markit. As of October 2, 2024.
9 Source: Bloomberg. As of July 30, 2024.
10 Source: Bloomberg. Gold performance represented by Gold United States Dollar Spot Index. As of September 2, 2024.
11 Source: BlackRock, Markit. ETF groupings determined by Markit. As of October 2, 2024.
12 Source: BlackRock, Markit. ETP groupings determined by Markit. As of October 2, 2024.
Carefully consider the Funds' investment objectives, risk factors, and charges and expenses before investing. This and other information can be found in the Funds' prospectuses or, if available, the summary prospectuses, which may be obtained by visiting the iShares Fund and BlackRock Fund prospectus pages. Read the prospectus carefully before investing.
Investing involves risk, including possible loss of principal.
Small-capitalization companies may be less stable and more susceptible to adverse developments, and their securities may be more volatile and less liquid than larger capitalization companies.
Actively managed funds do not seek to replicate the performance of a specified index, may have higher portfolio turnover, and may charge higher fees than index funds due to increased trading and research expenses.
International investing involves risks, including risks related to foreign currency, limited liquidity, less government regulation and the possibility of substantial volatility due to adverse political, economic or other developments. These risks often are heightened for investments in emerging/ developing markets or in concentrations of single countries.
Convertible securities are subject to the market and issuer risks that apply to the underlying common stock.
Funds that concentrate investments in specific industries, sectors, markets or asset classes may underperform or be more volatile than other industries, sectors, markets or asset classes and than the general securities market.
This information must be preceded or accompanied by a current prospectus for the iShares Gold Trust. Investors should read it carefully before investing. Click here for a current prospectus.
The iShares Gold Trust is not an investment company registered under the Investment Company Act of 1940, and therefore is not subject to the same regulatory requirements as mutual funds or ETFs registered under the Investment Company Act of 1940. The Trust is not a commodity pool for purposes of the Commodity Exchange Act. Before making an investment decision, you should carefully consider the risk factors and other information included in the prospectus.
Following an investment in shares of the Trust, several factors may have the effect of causing a decline in the prices of gold and a corresponding decline in the price of the shares. Among them: (i) Large sales by the official sector. A significant portion of the aggregate world gold holdings is owned by governments, central banks and related institutions. If one or more of these institutions decides to sell in amounts large enough to cause a decline in world gold prices, the price of the shares will be adversely affected. (ii) A significant increase in gold hedging activity by gold producers. Should there be an increase in the level of hedge activity of gold producing companies, it could cause a decline in world gold prices, adversely affecting the price of the shares. (iii) A significant change in the attitude of speculators and investors towards gold. Should the speculative community take a negative view towards gold, it could cause a decline in world gold prices, negatively impacting the price of the shares.
Commodities' prices may be highly volatile. Prices may be affected by various economic, financial, social and political factors, which may be unpredictable and may have a significant impact on the prices of commodities.
Investing in commodity-linked derivatives and commodity-related companies may increase volatility. Price movements are outside of the Fund’s control and may be influenced by weather and climate conditions, livestock disease, war, terrorism, political conflicts and economic events, interest rates, currency and exchange rates, government regulation and taxation. Commodity futures trading may be illiquid. In addition, suspensions or disruptions of market trading in the commodities markets and related futures markets may adversely affect the value of the Fund.
The iShares GSCI Commodity Dynamic Roll Strategy ETF is a commodity pool, as defined in the Commodity Exchange Act and the applicable regulations of the Commodity Futures Trading Commission, or “CFTC,” and is managed by its Advisor, BlackRock Fund Advisors, a commodity pool operator registered with the CFTC.
The Fund's use of derivatives may reduce the Fund's returns and/or increase volatility and subject the Fund to counterparty risk, which is the risk that the other party in the transaction will not fulfill its contractual obligation. Commodity futures trading may be illiquid. In addition, suspensions or disruptions of market trading in the commodities markets and related futures markets may adversely affect the value of the Fund. Certain derivatives may give rise to a form of leverage and may expose the Fund to greater risk and increase its costs. To the extent that the Fund invests in rolling futures contracts, it may be subject to additional risk. An increase in interest rates may cause the value of fixed-income securities held by the Fund to decline.
Diversification and asset allocation may not protect against market risk or loss of principal.
Fixed income risks include interest-rate and credit risk. Typically, when interest rates rise, there is a corresponding decline in the value of debt securities. Credit risk refers to the possibility that the debt issuer will not be able to make principal and interest payments.
Non-investment-grade debt securities (high-yield/junk bonds) may be subject to greater market fluctuations, risk of default or loss of income and principal than higher-rated securities.
This material represents an assessment of the market environment as of the date indicated; is subject to change; and is not intended to be a forecast of future events or a guarantee of future results. This information should not be relied upon by the reader as research or investment advice regarding the funds or any issuer or security in particular.
The strategies discussed are strictly for illustrative and educational purposes and are not a recommendation, offer or solicitation to buy or sell any securities or to adopt any investment strategy. There is no guarantee that any strategies discussed will be effective.
There is no guarantee that dividends will be paid.
There can be no assurance that an active trading market for shares of an ETF will develop or be maintained.
A fund's use of derivatives may reduce a fund's returns and/or increase volatility and subject the fund to counterparty risk, which is the risk that the other party in the transaction will not fulfill its contractual obligation. A fund could suffer losses related to its derivative positions because of a possible lack of liquidity in the secondary market and as a result of unanticipated market movements, which losses are potentially unlimited. There can be no assurance that any fund's hedging transactions will be effective.
Investment in a fund of funds is subject to the risks and expenses of the underlying funds.
This material represents an assessment of the market environment as of the date indicated; is subject to change; and is not intended to be a forecast of future events or a guarantee of future results. This information should not be relied upon by the reader as research or investment advice regarding the funds or any issuer or security in particular.
The strategies discussed are strictly for illustrative and educational purposes and are not a recommendation, offer or solicitation to buy or sell any securities or to adopt any investment strategy. There is no guarantee that any strategies discussed will be effective.
This material contains general information only and does not take into account an individual's financial circumstances. This information should not be relied upon as a primary basis for an investment decision. Rather, an assessment should be made as to whether the information is appropriate in individual circumstances and consideration should be given to talking to a financial professional before making an investment decision.
The Funds are distributed by BlackRock Investments, LLC (together with its affiliates, "BlackRock").
The iShares Funds are not sponsored, endorsed, issued, sold or promoted by Bloomberg, BlackRock Index Services, LLC, Cboe Global Indices, LLC, Cohen & Steers, European Public Real Estate Association (“EPRA® ”), FTSE International Limited (“FTSE”), ICE Data Indices, LLC, Nasdaq, Inc., NSE Indices Ltd, JPMorgan, JPX Group, London Stock Exchange Group (“LSEG”), MSCI Inc., Markit Indices Limited, Morningstar, Inc., Nasdaq, Inc., National Association of Real Estate Investment Trusts (“NAREIT”), Nikkei, Inc., Russell, S&P Dow Jones Indices LLC or STOXX Ltd. None of these companies make any representation regarding the advisability of investing in the Funds. With the exception of BlackRock Index Services, LLC, who is an affiliate, BlackRock Investments, LLC is not affiliated with the companies listed above.
Neither FTSE, LSEG, nor NAREIT makes any warranty regarding the FTSE Nareit Equity REITS Index, FTSE Nareit All Residential Capped Index or FTSE Nareit All Mortgage Capped Index. Neither FTSE, EPRA, LSEG, nor NAREIT makes any warranty regarding the FTSE EPRA Nareit Developed ex-U.S. Index, FTSE EPRA Nareit Developed Green Target Index or FTSE EPRA Nareit Global REITs Index. “FTSE®” is a trademark of London Stock Exchange Group companies and is used by FTSE under license.
© 2025 BlackRock, Inc or its affiliates. All Rights Reserved. BLACKROCK, iSHARES, iBONDS, LIFEPATH, ALADDIN and the iShares Core Graphic are trademarks of BlackRock, Inc. or its affiliates. All other trademarks are those of their respective owners.
iCRMH1024U/S-3912109