00:00:00:00 - 00:24
Aaron Task
Welcome to In the Know. I'm Aaron Task And my guest for this episode is Rick Rieder, Chief Investment Officer of Global Fixed Income at BlackRock, where he's responsible for roughly $2.7 trillion in assets.
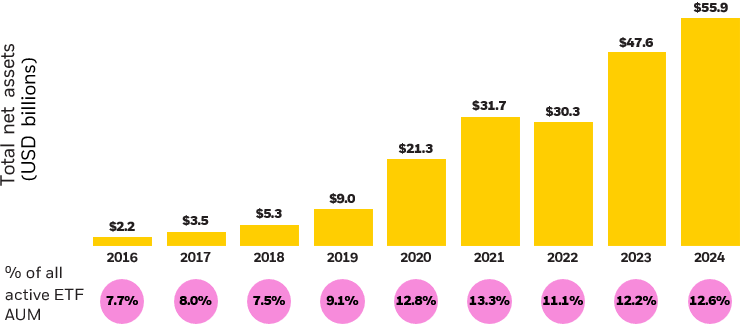
Among the several funds Rick manages is the BlackRock Flexible Income ETF, ticker symbol BINC, an active ETF which launched in May 2023. Rick, welcome.
00:24 – 00:25
Rick Rieder
Thanks for having me. Appreciate it.
00:26 – 00:33
Aaron Task
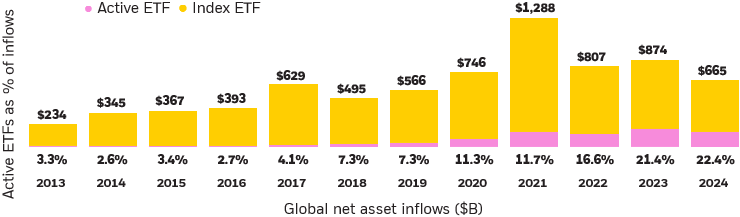
All right. For those who don't know: what are active ETFs and why do you think they're growing in popularity right now?
00:33 - 2:02
Rick Rieder
So it's a couple of things. First of all fixed income, I think for the first time in my career, it is you can get income. And you think about what it used to be, your low rate environment... people looked at fixed income as a way to hedge or to manage risk against equities. Now it's actually fixed income that you're getting and that that's pretty darn exciting.
So now the question is how do you do it actively when indices are built in a world where debt is going on governments and they're issuing in the long end of the yield curve. Do I need a lot of that? You have an opportunity to look at what is. It's a little like a kid in a candy store as the manager of this: what are the best opportunities across fixed income?
Parts of indices like mortgage or parts of the mortgage market you don't want to own because they they're negatively convexity — they don’t move with interest rates. They're 68,000 securities in fixed income. Your ability to go and find what is the best around that. It's very hard for an individual to do that.
But your ability to look at a complex asset, think about its collateral, etc., and then put it together in a diversified portfolio in fixed income to get somebody fixed income without a lot of volatility to marry to equities, married to real estate or other holdings I have is pretty exciting. And that's why you're going to see it continue to grow.
You get real yield. Interest rates are going to come down a bit, but they're still going to stay higher than we've seen in a long time. And so you can really get income if built properly.
02:02 - 2:30
Aaron Task
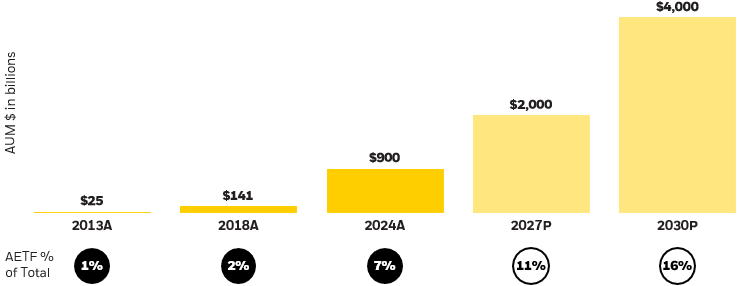
Right. So we'll drill down into BINC a little bit more. But just for the folks who maybe aren't familiar with active ETFs — We at Blackrock, we're projecting that globally active ETF assets under management are going to more than quadruple to $4 trillion by 2030. So how would you define an active ETF broadly speaking versus most people think of ETFs — it's an index, right? And why do you think there's so much interest in them right now?
2:31:09 – 3:14
Rick Rieder
So it's a couple of things. First of all fixed income is different than equities in that equities grow based on companies doing better and the return on equity grows. So you get more of those exposure. Fixed income is the exact opposite. If companies are putting on more debt, you own it. If you own if you own the index and actually you don't necessarily want to be where somebody else is selling you, selling you debt, but you want to be where the best opportunity presents itself.
The reason why this market is going to grow, and I think will continue to grow, is a) people have built a tremendous amount of cash over the over the last few years because cash is a super attractive asset.
Now you have the ability — let's lock it in, let's build this income and let's do it in an efficient manner. And I think that's why you'll see this growth that will continue for a for a long time.
3:14 – 3:20
Aaron Task
Okay. So who is BINC for, what type of investors is it made for.
3:20 – 3:54
Rick Rieder
So you think about how the world of industry has changed this idea that you can be and think about technologies allowing us to do things, be more precise, think about where you want to be and whatever asset is in the world. Do you think about delivery of things like retail goods, etc.?
What now Active ETFs are letting you to do is be precise about ‘I would like income at a lower volatility.
I'd like mortgages but I'd like them here.’ What it's allowing you to do now is to be more precise, the reason why you think growth of models, huge growth models, because you can be precise in the type of investment that you're getting today.
3:54 – 3:58
Aaron Task
You're referring to model portfolios that a lot of financial advisors are gravitating towards.
3:59 – 4:11
Rick Rieder
Correct. And and it's all in this world of technology has allowed the building of these products to allow you to get the expression that makes the most sense, and that fits in a portfolio based on what you're trying to achieve.
4:12 - 4:31
Aaron Task
Right. And it's BINC as other active ETFs are in the ETF wrapper, which is we like to talk about here a lot. They're more they're tax efficient. They're liquid. They're transparent. Can't you and frankly don't you do some of the same strategies in a mutual fund? So you know why we have the active ETF as well.
4:32 – 5:18
Rick Rieder
So I think mutual funds will live forever. And part of why they live forever is in a mutual fund. I can do some things around direct financing or other things that are less liquid, a bit more bespoke, that I wouldn't put in the ETF.
The reason why I think they will live together — and the growth of ETFs will be faster because they just haven't developed to the size of mutual funds — is an ETF people can look at and deconstruct it look at how it's going to move, what the beta is, and think about what that will do relative to a mutual fund. And I think you'll see people say I can use them effectively because of liquidity. I can use them because of the tax efficiency, but I want to marry them to also to mutual funds.
And I think you'll see both — different characteristics, but both serve a real purpose in a portfolio.
5:18 – 5:53
Aaron Task
Right. So it's a new tool in the toolkit as opposed to replacing some other tool.
So you referenced in the beginning, BINC was launched in May 2023, and I think it's fair to say it's been a somewhat unusual period in fixed income. There's so much uncertainty about what the Fed's going to do, whether they're going to do anything when they're going to do it.
You have this positive correlation between stocks and bonds, an inverted yield curve that's been inverted for longer I think certainly longest in recent memory. Ahh recent history. So how have you approached managing BINC in that environment?
5:53 – 7:10
Rick Rieder
So couple things. One, manage your interest rate risk. And what we're trying to do is keep our interest rate risk — we've been increasing it recently — but keep it on a reasonably low level because interest rates aren't coming down that fast. They're coming down. I think they'll come down now, but it'll be very moderate. This Fed is going to be deliberate, get as much income as you can and keep it stable.
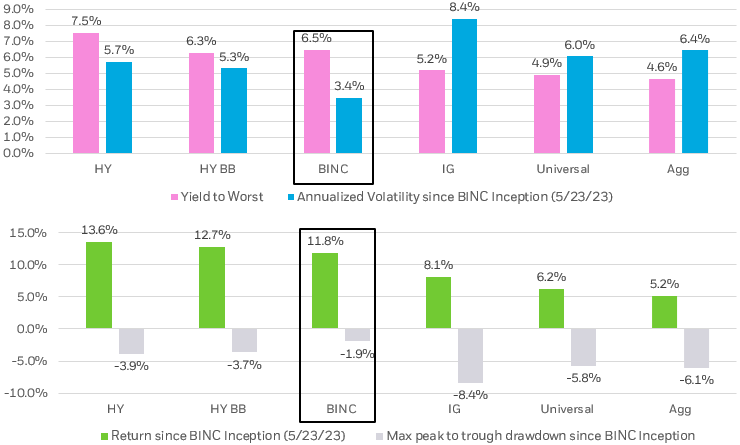
So we try and get a lot of high-quality assets in there. Investment grade credit, triple-A CLOs, European investment grade credit, agency mortgages. Run a portfolio that’s high triple-B average rating. Run it with the same volatility of or similarly lower volatility of things like double-B high yield or the Aggregate Index. Keep it stable. Keep your volatility down, keep your rating at a reasonably high level.
And then just do something that is hard for people to people to create on their own. And our, you know, quite frankly, one of our best advantages is use all your tools. There's so many sophisticated tools in fixed income now to manage stress risk, scenario analysis, to think about correlations between assets. Very hard for an individual to do that.
Try and put it together in a package that's high yield, low volatility and consistent performance over time. And I think the returns have been double digit over the last year where fixed income hasn’t given you much at all.
7:10 - 7:36
Aaron Task
Right. So as an individual investor and I think a lot of individuals find fixed income hard just for starters. Like many people don't even know what that is. They like they know stocks maybe ETFs probably but not fixed income. So how would you describe and I think maybe you just did. But again how would you describe what BINC is and how what it does for investors versus investing in an index like the Agg.
7:36 – 8:10
Rick Rieder
Think about high yield. A lot of the high yield market is triple-C credit. That's got some stress or double-B credit that trades very tight through investment grade. The beauty of what BINC does and says ‘I only want the parts of high yield that make sense.’ Single B high yield in the U.S. Double-B in Europe. Want to be a little higher quality - growth is a little bit slower.
But I want to be precise around I want to own the best parts of it without I'm just going to take one asset. And so putting all those pieces together you can create something that is higher rated, more liquid, more stable, less volatility but still get you terrific yield.
8:11 – 08:27
Aaron Task
Right. And so my understanding is you can go theoretically anywhere in the world — in a fixed income asset — but you have limitations within BINC as to how much of one kind or another you can own at any time. How would you, you know, on a podcast, it's hard for people to, you know, see a list of it, but how would you describe that?
8:28 – 8:57
Rick Rieder
So couple things. One, we try and get it to the more the plus sectors of fixed income. So we're only going to run of high quality assets, investment grade agency mortgages. We're only going to run at a 20% or so of the portfolio. We're trying to get the harder-to-access assets. It's got some real yield to it. But don't do it in a way that is just ‘I'm going to be blunt tools that don't make a lot just because they get yield.’
They’re parts of emerging markets where the volatility is extreme get you a lot of yield. But boy, what it's going to do to your volatility. Your overall portfolio doesn't make a lot of sense right.
8:58 – 9:02
Aaron Task
It's a risk reward. You know the the more potential reward the higher risk you're likely taking.
9:03 – 9:44
Rick Rieder
Totally. And by the way places like emerging markets are some stable names in emerging markets that still get you a lot of yield for a for a variety of reasons. Mexico, Brazil, Indonesia. Take some pieces of that, then marry it to the parts of the high-yield market that are makes sense relative to their rating, makes sense relative to where the rest of the market is.
And just do that and just pick the best parts of of each of them. And around the world. People don't realize like when you extend your reach to the global fixed income system, particularly today, as a dollar investor. You get a cross currency benefit, you get a swap benefit. So if you buy European high yield, you buy European investment grade, you get an extra 150 basis points.
Fantastic.
9:44 – 9:45
Aaron Task
Because of the dollar strength.
9:45 – 10:00
Rick Rieder
Because of the dollar strength. And and so by the way, if you think about near in there those other domiciles, you're on the other side of, that's why it's harder for those entities to buy it. But for a dollar investor it's fantastic. And you should get into buy good quality companies and just get a boost for the currency.
10:00 – 10:13
Aaron Task
Right? So again, there's no one stop shop or one, one size fits all. But for I don't want to say average investor, but for someone with the traditional portfolio, where do you see and how do you see BINC fitting into the portfolio construction.
10:14 – 10:55
Rick Rieder
So I think in terms of the future of fixed income. So historically it was okay, balance was 60/40. Balance was I know I gotta own my long interest rate exposure against equities. Think about where we're going in the world. More debt more debt, more deficits. U.S. governments got to issue a lot of it. Why do I want to own that?
Then I think about, gosh, do I want to own — there are a lot of high-quality issuers in the world that don't pay you a lot of spread. Do I need to own that? Take the bad parts out that don't do anything for a portfolio. Optimize. I just want income, I want yield, I want stable. And by the way, it doesn't mean that we don't have some volatility whenever you're buying assets. High yield, etcetera. You have some volatility. It's can you manage it effectively to take advantage of yields that are historically high.
10:56 – 11:50
Aaron Task
All right. For those who might be interested in you could access BINC the same way you buy any iShares ETF through a brokerage platform like fidelity or through your financial advisor. And if you work with an advisor, talk to your advisor and explore how iShares ETFs may fit your goals.
And so, Rick, before we wrap, obviously, you know, obviously for folks who work on Wall Street or cover the market, you're very well known for people who may not know who you are outside of work.
You're also, in addition to your work here at BlackRock, you're a member of the ownership group of the Baltimore Orioles, and you're on the board of several organizations, including Emory University, the Graduation Gen Public School Collaboration in Atlanta, the hospital for Special Surgery, and North Star Academies, charter schools in Newark, where you're the chairman. So what can you teach me about time management?
Because it seems like you have a lot on your plate. How do you how do you juggle all that.
11:51 – 12:55
Rick Rieder
less sleep and, I don't, you know, I think, you know, I have a I have a credo that is work hard, play hard, give back. And I really believe in that. You know, we have obviously, a career takes a tremendous amount of time. But there's also, if you allocate to where you also would like to go in life.
And, I know I'm a big believer in giving back, and I'm a big believer in, you know, you got to enjoy your life, but you try and like, isolate, you know, the amounts of time that you spend on each. And I think it creates balance. And I quite frankly, as an investor, I think you need to have balance.
And I think you need to get away and think about other things and think about the big picture. And so it's a big, important part of my life. And it's like when I come in Monday morning, like I'm ready to go. But, you know, I work a ton over the weekend. You got to prepare for the for the, for the week ahead.
But you're also doing things you enjoy doing. You're also thinking about things outside of finance. Yeah. Yeah. That are, you know, and listen, I think the world, you know, things like education, things like helping people that that can achieve. And by the way, we've hired some into our business, which I think is super exciting, but I think it's, it gives you a balance in your life.
12:55 – 13:07
Aaron Task
And at this point in your career, when I'm going to go out on a limb and say, you could probably step back and be okay. Like what what motivates you to keep going? Like what makes you tick every day, as you say, to get a Monday morning to come into, to come into the office.
13:07 – 14:02
Rick Rieder
So, so I think, I think this is the most dynamic industry in the world. I mean, I well, I'd rather play for the Baltimore Orioles, but that's not available would do it. You know, given that that's not available, it is a this is the most dynamic industry in the world you think about. You come in, you know, part of what's exciting coming in Monday morning about, well, politics just changed that affects you in different parts of the market.
We get economic data that comes out this week or next week. We get supply that's coming to the market. Like the menu of things you could do is incredibly exciting. And it's, you know, it is. I don't describe it. It is it is a challenge. It's like a treasure hunt or a game that, you know, you constantly want to get to the next level and achieve.
And it's incredibly humbling because you lose a lot. Right. And, you know, and I think it's the whole and I've learned over my career, like in school, you're trying to get it right 95% of the time. Like we're trying to get it right 65 or 70% of the time. Just do it over and over again. But there's a lot to do to try and create that.
You just, you know, there's so many things to look at to make it fun.
14:02 – 14:04
Aaron Task
All right, Rick, thanks very much for being with us today.
14:04 – 14:05
Rick Rieder
Thank you.
Spoken Disclosure:
Visit www.iShares.com to view a prospectus, which includes investment objectives, risks, fees, expenses and other information that you should read and consider carefully before investing.
Investing involves risk, including possible loss of principal.
Written Disclosure:
Carefully consider the Funds' investment objectives, risk factors, and charges and expenses before investing. This and other information can be found in the Funds' prospectuses or, if available, the summary prospectuses which may be obtained by visiting www.iShares.com or www.blackrock.com. Read the prospectus carefully before investing.
Investing involves risk, including possible loss of principal.
Fixed income risks include interest-rate and credit risk. Typically, when interest rates rise, there is a corresponding decline in the value of debt securities. Credit risk refers to the possibility that the debt issuer will not be able to make principal and interest payments. Non-investment-grade debt securities (high-yield/junk bonds) may be subject to greater market fluctuations, risk of default or loss of income and principal than higher-rated securities.
Collateralized Debt Obligations (“CDOs”) carry additional risks including, but not limited to: (i) the possibility that distributions from collateral securities will not be adequate to make interest or other payments; (ii) the risk that the collateral may default or decline in value or be downgraded, if rated by a nationally recognized statistical rating organization; (iii) the Fund may invest in tranches of CDOs that are subordinate to other tranches; (iv) the lack of a readily available secondary market for CDOs.
International investing involves risks, including risks related to foreign currency, limited liquidity, less government regulation and the possibility of substantial volatility due to adverse political, economic or other developments. These risks often are heightened for investments in emerging/developing markets and in concentrations of single countries.
Actively managed funds do not seek to replicate the performance of a specified index, may have higher portfolio turnover, and may charge higher fees than index funds due to increased trading and research expenses. Active funds are subject to management risk, which means the fund manager's techniques may not produce desired results, and the selected securities may not align with the fund's investment objective. Legislative, regulatory, or tax developments may also affect the fund manager's ability to achieve the investment objective.
Transactions in shares of ETFs may result in brokerage commissions and may generate tax consequences. All regulated investment companies are obliged to distribute portfolio gains to shareholders. There can be no assurance that an active trading market for shares of ETFs will develop or be maintained.
The strategies discussed are strictly for illustrative and educational purposes and are not a recommendation, offer or solicitation to buy or sell any securities or to adopt any investment strategy. There is no guarantee that any strategies discussed will be effective. The information presented does not take into consideration commissions, tax implications, or other transactions costs, which may significantly affect the economic consequences of a given strategy or investment decision.
This material contains general information only and does not take into account an individual's financial circumstances. This information should not be relied upon as a primary basis for an investment decision. Rather, an assessment should be made as to whether the information is appropriate in individual circumstances and consideration should be given to talking to a financial professional before making an investment decision.
The Funds are distributed by BlackRock Investments, LLC (together with its affiliates, “BlackRock”).
© 2024 BlackRock, Inc. or its affiliates. All Rights Reserved. BLACKROCK and iSHARES are trademarks of BlackRock, Inc. or its affiliates. All other trademarks are those of their respective owners.