Updated: January 7, 2025
A guide to investing in clean energy ETFs
Apr 13, 2023 Equity
KEY TAKEAWAYS
- Advances in key technologies and supportive policies have driven significant cost declines and the early adoption of clean energy.
- Massive recent public sector investment programs in the U.S., Europe, China, Japan and beyond could accelerate adoption further, bringing clean energy to the mainstream.
- Continued innovations in solar, wind, as well as newer technologies like hydrogen, could further drive growth.
- Investors looking to gain exposure to clean energy may want to consider ETFs that offer exposure to the full value chain, including power generation and technology across several renewable sources.
CLEAN ENERGY MAY BE PRIMED TO BECOME THE FOUNDATION OF GLOBAL ENERGY SYSTEMS
Wind and solar adoption accelerated clean power’s penetration of the global electricity mix. Renewable energy sources now generate 30% of all global electricity, up from the 19% share held in 2000.1 Advances made in solar and wind technologies, and supportive policies, made this possible. More efficient and reliable solar panels and wind turbines, on top of financial support from the public sector, has dramatically lowered the cost of clean power to well below that of fossil fuels.2 This is incentivizing rapid adoption and economies of scale that have driven further cost declines.3 Looking forward, the International Energy Agency (IEA) projects that global renewable energy sources could account for more than 42% of global electricity generation by 2028, with the share of wind and solar doubling to 25%.4
CLEAN ENERGY ENJOYS A GLOBAL EMBRACE
Countries around the world are transitioning to clean energy sources for reliable, affordable, and clean power. Amid 2022’s energy supply shock, governments enacted new legislation to rapidly expand clean energy infrastructure. A combined $2 trillion is needed annually across renewables and grid & storage in order to reach the 2030 tripling goal established at COP28, doubling the current investment as of February 2024.5
In the U.S., the Inflation Reduction Act, marking the most significant action Congress has ever taken on clean energy and climate change,6 has the potential to be a gamechanger for both supply and demand. It includes approximately $370 billion in clean energy-related spending to strengthen domestic energy security and reduce emissions, investing in wind and solar power production, manufacturing across the clean energy value chain, and clean energy-enabling technologies related to electrification and energy efficiency.
Significant public spending
Breakdown of public investment in major climate-related U.S. legislation, as of December 2022
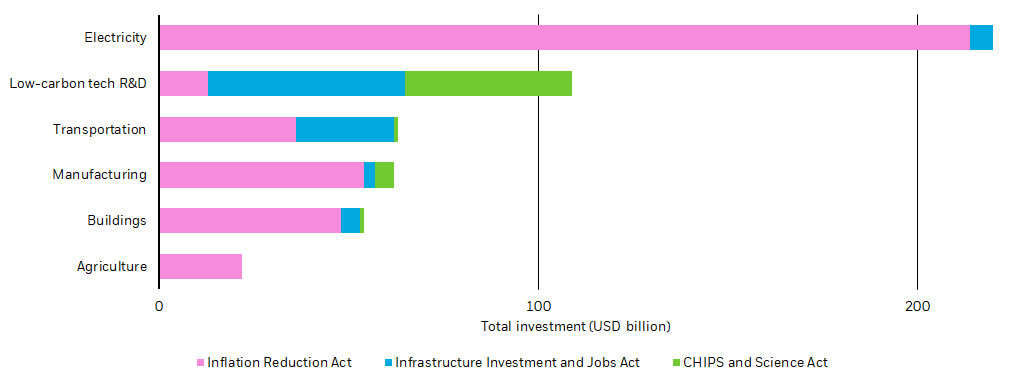
BlackRock Investment Institute and Rocky Mountain Institute, December 2022. Notes: The chart shows a breakdown of estimated investment and incentives in this year’s major U.S. legislation that had climate-related elements – the Inflation Reduction Act, the Infrastructure Investment and Jobs Act and the CHIPS and Science Act – as estimated by RMI (see https://rmi.org/climate-innovation-investment-and-industrial-policy) The analysis should be considered approximate and may be updated or refined by subsequent analysis. Low carbon tech R&D can be broken down into the following components: 26% clean tech general, 22% basic science, 21% hydrogen, 19% nuclear, and 12% carbon neutral.
Chart description: The stacked bar chart shows a breakdown of public spending in billions of US dollars from major climate-related U.S. legislation, including the Inflation Reduction Act, the Infrastructure Investment and Jobs Act, and the CHIPS and Science Act.
We think clean energy producers and technology manufacturers could benefit as tax credits, investments, and direct purchases may help boost revenues and improve margins. Solar PV and onshore wind additions through 2028 are expected to more than double in the United States, the European Union, India and Brazil compared with the last five years. In the U.S., the Inflation Reduction Act has acted as a catalyst for accelerated additions.7
It is also worth noting that 2021’s Infrastructure Investment and Jobs Act (IIJA) included support for clean energy, investing tens of billions in clean sources and enabling technologies that could improve viability and extend clean energy’s reach beyond the power sector to unelectrified end-uses across transportation, buildings, and industry.8
Outside of the U.S., global efforts are ramping up significantly:
- Europe: In 2022, the EU made plans to adopt the €210 billion REPowerEU initiative.9,10 The initiative increases the EU’s 2030 target for clean energy generation to 45% and would grow clean energy capacity by an additional 15%.11 The program joins the EU’s Global Gateway program as a major part of the bloc’s plan to accelerate energy transition. The Global Gateway seeks to invest €300 billion to support sustainable development around the world.12 In June of 2024, the European Commission adopted Net Zero Industry Act, aimed at bolstering manufacturing of clean technologies with an objective of meeting 40% of EU’s deployment needs by 2030.13
- China: In March 2022, China released its 14th Five-Year Plan (14FYP), which seeks to grow clean energy output by 50% by 2025, primarily through wind and solar.14 The plan represents a major stride in outlining how the country will meet its 2030 emissions target and 2060 carbon neutrality goals. China has also retained its position as the world’s leader in battery electric vehicle (BEV), one out of every four cars in China in 2023 was a BEV.15
- Japan: Japan enacted its Green Transformation Program in 2022, which will invest $126 billion to meet decarbonization goals, with a significant share of those dollars going to alternative energy sources, technologies and infrastructure.16
CONTINUED INNOVATION COULD ACCELERATE THE ADOPTION OF CLEAN ENERGY
By 2026, some estimate that global renewable-electric capacity could rise more than 80% from 2020 levels, with two-thirds coming from wind and solar.17
Wind Power
The world has come a long way since the advent of the windmill. Onshore wind farms contain hundreds, sometimes thousands, of individual turbines which stand ~310 feet tall and boast long blades that give them 410-foot diameters.18 Just one of them can power 940 American homes.19 Turbines are becoming more and more efficient as advances in technology and engineering improve their design and lower costs.
Advances in wind power technology drove costs down, incentivizing new wind projects and expanding installed wind power capacity
Installed wind capacity (GW)
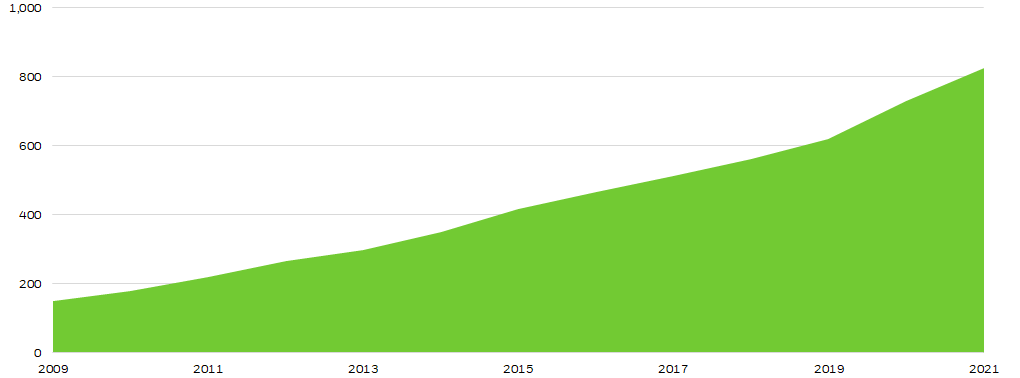
Source: BP, 2022.
Chart description: The area chart shows the installed wind capacity in gigawatts over time. The chart shows that wind power capacity has expanded over time.
Advanced materials, and new engineering techniques, are making turbines bigger still; in July 2023, the world’s largest win turbine went online with a 853 ft rotor diameter with three 404 ft blades.20 Other technologies like embedded sensors and artificial intelligence are providing additional benefits, adjusting turbine positioning in real-time to optimally capture the wind.
Solar Power
Solar power is fast growing. In the U.S., solar accounted for 59% of new electricity-generating capacity added to the grid in the first half of 2024.21 Developers and power plant owners added 21% more capacity during the first half of 2024 than during the first six months of 2023, with an additional 42.6 GW of capacity expected in the second half of the year.22
Advances across the solar value chain led to adoption-driving solar cost declines
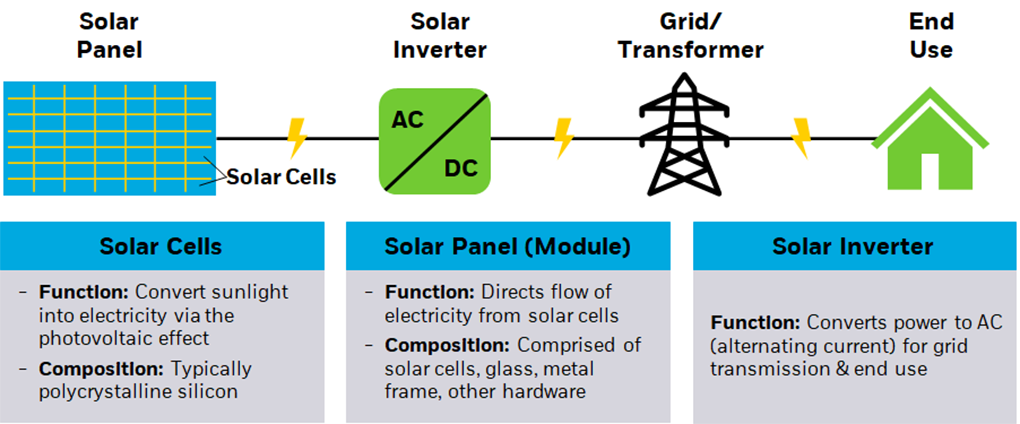
Source: For illustrative purposes only. BlackRock, 2023.
Efforts are underway to develop multijunction photovoltaic (PV) cells, or cells made with multiple semiconducting materials, which would have higher maximum efficiency thresholds than today’s silicon cells. Other materials, like perovskite and quantum dots, are showing significant success in laboratory settings. These materials could both improve solar PV efficiency and bring clean energy to new settings, including within paint and window glass.
Hydrogen
Hydrogen (H2) is the most abundant element in the universe but the new kid on the block in clean power. It contains 3x more energy content by weight than gasoline and burns without emissions. Electrolyzers can produce H2 with just two inputs — water (H20) and electricity. When that electricity is generated from clean energy sources, such as wind and solar, electrolyzers produce “green hydrogen” — one such type of hydrogen, which can be used in fuel cells or burned as a clean energy source. Some estimates show the green hydrogen value chain reaching $11 trillion by 2050.23 Clean energy sources can only go as far as the electric grid and 80% of today’s global energy consumption comes from off-grid end uses (e.g., gas in cars, oil and coal in industrial production). Green hydrogen represents a clean energy source for these end uses when electrification is not an option.
Clean power only reaches as far as electric infrastructure allows. Efforts to electrify end uses and produce green hydrogen will drive new demand for clean power
Clean sources' share of energy consumption and electricity generation (%)
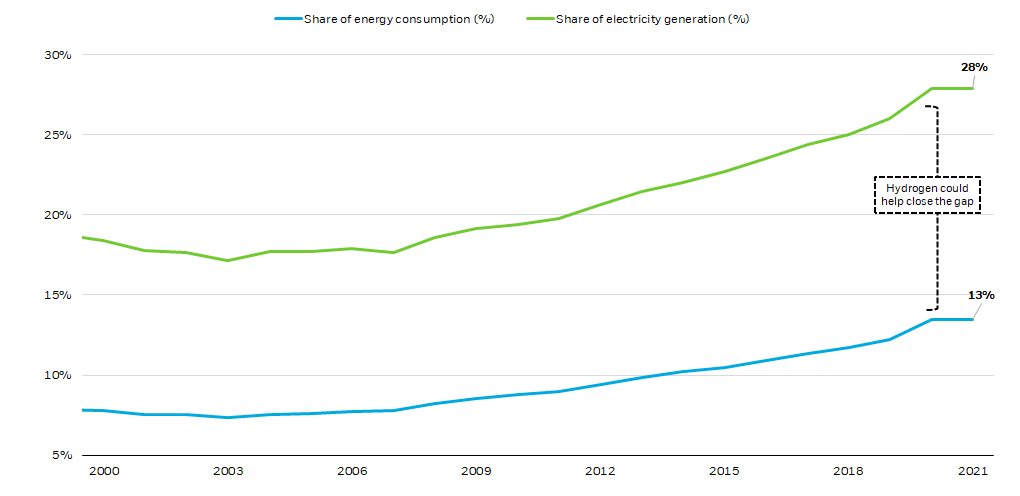
Source: IEA, 2022.
Chart description: The line chart illustrates clean sources' share of energy consumption and electricity generation. The chart shows that the share of electricity generation (%) is higher than the share of electricity consumption (%).
INVESTING IN CLEAN ENERGY
Investors seeking to capture this theme may want to consider ETFs that offer exposure not to any one clean energy source, such as solar or wind, but the full range of producer types and the many enablers of these technologies, including:
- Companies involved in the generation and distribution of clean energy from wind, solar, and geothermal sources, as well as producers of hydrogen and bioenergy
- Companies involved in manufacturing technologies and components used to generate and distribute clean energy, including, but not limited to:
- Wind: Wind turbines and the components that comprise them, including wind blades, nacelles, driveshafts, gearboxes, sensors, and generators
- Solar: Solar modules, silicon and other solar cells, solar glass, inverters, charge controllers, batteries, racks, and materials related to each
- Hydrogen: Fuel cells, electrolyzers, fueling stations
CONCLUSION
We expect continued innovation and resulting improvements in clean energy economics to meaningfully accelerate clean energy’s penetration of the global power and energy mixes. Supportive policies and investment should secure such a shift, serve as a boon for clean energy companies and bring about new potential growth opportunities. Forward-thinking investors looking to capture the growth of clean energy can see which way the wind is blowing and that the sun could rise over a bright new day for renewables.
