- Cutting-edge environmental technologies are here: Mounting breakthroughs from electric vehicles to carbon capture combined with increasing demand and affordability are helping drive growth for environmental technologies.
- Public and private actions towards carbon reduction: Over $1.3 trillion USD has been allocated by governments towards clean energy investment support since 2023. While over 9000 corporations signed up for the race to zero campaign, which prioritizes cutting global emissions in half by 2030.1,2
- Early-stage technologies are driving innovation: We believe investors may benefit from exposure to ETFs designed to invest in a broad basket of nascent environmental technologies such as pollution reduction, energy efficiency, and breakthroughs in transportation and power.
Investing in the next generation of environmental tech breakthroughs
Sep 04, 2024 Equity
KEY TAKEAWAYS
THE KEY DRIVERS OF NEXT GEN ENVIRONMENTAL SOLUTIONS
We see three key reasons why next-generation environmental technologies will be increasingly important in our economy:
First, governments and companies around the globe have made ambitious climate commitments to reduce emissions, and have passed legislation such as the Inflation Reduction Act which designated nearly $400B towards clean energy technologies and electric vehicles.3 Countries representing nearly 90% of the world economy now have net-zero commitments.4 The private sector has also made commitments, with over 37% of the world’s largest publicly traded companies announcing carbon reduction targets.5 However, the private sector is not just making commitments, they are also following through with their wallet. For example, in 2023, climate-tech companies raised over $50 billion in venture capital and private equity funding.6 Companies know that meeting these commitments requires leveraging environmental technology breakthroughs across areas such as green transportation, renewable energy and energy efficiency, which have the potential to significantly offset the growth of greenhouse gas emissions.
Second, the shift toward renewable energy has accelerated in some markets amidst a global focus on energy security. For example, Germany announced plans to accelerate their transition to renewables, bringing forward their target for 100% renewable power by 15 years, to 2035.7 New government policies around the globe will lead to annual clean energy investments of more than $2 trillion by 2030, a 50% increase from today’s levels.8
Finally, consumers are reporting increased interest in sustainable products. Whether its buying electric vehicles, installing cutting-edge solar panels on their roof or installing smart meter technologies in their home to reduce energy usage, consumers may continue to turn towards environmentally friendly technologies and products.
Levels of consumer interest in sustainable products

Source: "The Sustainability Disconnect Between Consumers & Retail Executives", First Insight, Inc., The Baker Retailing Center at the Wharton School of the University of Pennsylvania, Jan 2022.
Chart description: First Insight and the Baker Retailing Center at the Wharton School of the University of Pennsylvania’s findings are based on survey studies of a targeted sample of > 1,000 consumers in the U.S., fielded in 2021. 68% of the consumers say that they are willing to pay more for sustainable products, while 72% of consumers say that sustainability is a very or somewhat important purchase consideration.
THE POTENTIAL BENEFITS OF GETTING THERE EARLY
If investors are looking to gain access to environmental technologies, they may want to consider focusing on companies whose products and services are in the early stages of adoption. Later-stage products and companies are typically larger and more mature, and already found in broad equity benchmarks such as the S&P 500.
For example, rewinding the clock to 2010, when renewable energy’s share of US electricity generation was 10%. Fast forward 10 years and renewable’s share doubled to 20%.9 During this timeframe the S&P Global Clean Energy Index outperformed the S&P 500 energy index by 74%!10 We believe accessing environmental technology companies ahead of their acceleration in adoption could benefit investors, as the transition becomes more fully priced.
Renewable energy share of U.S. electricity generation

Source: Deloitte Insights. "Renewable transition separating perception from reality". September 21, 2021.
Chart description: Chart showing that renewable energy's share of US electricity generation has doubled — from 10% in 2010 to 20% in 2020.
2010 – 2020 Outperformance of S&P Global Clean Energy Index vs. S&P 500 Energy Sector (%)

Source: Morningstar, returns from 1/1/10 to 12/31/20.
Index performance is for illustrative purposes only. Index performance does not reflect any management fees, transaction costs or expenses. Indexes are unmanaged and one cannot invest directly in an index. Past performance does not guarantee future results. Index performance does not represent actual Fund performance. For actual fund performance, please visit www.iShares.com or www.blackrock.com.
Chart description: Chart showing that the S&P Global Clean Energy Index has outperformed the S&P 500 energy index by 73% from 2010 to 2020. The S&P Global Clean Energy Index returned 67% while the S&P 500 energy index returned -7%.
KEY BREAKTHROUGHS IN ENVIRONMENTAL SOLUTIONS
Below we highlight eight themes that could shape the future of environmental technologies,11 whose potential opportunity may be significant. Click into each of these themes to learn more.
A DIFFERENT WAY TO INVEST IN ENVIRONMENTAL TECH
With popular equity benchmarks such as the S&P 500 index lacking material exposure to environmental tech themes such as renewable energy, green transportation, and energy efficiency,40 a thematic investing strategy that delivers exposure to multiple environmental tech themes. For example, the Morningstar Global Emerging Green Technologies Select Index targets innovative companies with >25% revenue exposure to the eight themes listed below.
Caption:
Table reflects holdings in Morningstar Global Emerging Green Technologies Select Index as of December 2023. Subject to change.
| Emerging green technology category | Green transportation |
| Weight in Morningstar Global Emerging Green Technologies Select Index | 22% |
| Emerging green technology category | Renewable energy |
| Weight in Morningstar Global Emerging Green Technologies Select Index | 34% |
| Emerging green technology category | Energy efficiency |
| Weight in Morningstar Global Emerging Green Technologies Select Index | 17% |
| Emerging green technology category | Water |
| Weight in Morningstar Global Emerging Green Technologies Select Index | 7% |
| Emerging green technology category | Green buildings |
| Weight in Morningstar Global Emerging Green Technologies Select Index | 9% |
| Emerging green technology category | Pollution prevention and reduction |
| Weight in Morningstar Global Emerging Green Technologies Select Index | 5% |
| Emerging green technology category | Resource efficiency, technologies, and services |
| Weight in Morningstar Global Emerging Green Technologies Select Index | 4% |
| Emerging green technology category | Sustainable agriculture, food, and forestry |
| Weight in Morningstar Global Emerging Green Technologies Select Index | 0% |
| Emerging green technology category | Weight in Morningstar Global Emerging Green Technologies Select Index |
|---|---|
| Green transportation | 22% |
| Renewable energy | 34% |
| Energy efficiency | 17% |
| Water | 7% |
| Green buildings | 9% |
| Pollution prevention and reduction | 5% |
| Resource efficiency, technologies, and services | 4% |
| Sustainable agriculture, food, and forestry | 0% |
Source: Morningstar. Holdings as of December 2023. Weights reflect holdings in Morningstar Global Emerging Green Technologies Select Index.
A DIFFERENT WAY TO INVEST IN ENVIRONMENTAL TECH
The index is specifically focused on capturing companies whose products/services are “emerging green technologies”, defined as being in the innovators through early majority stage of the Rogers adoption curve,41 which means at least 50% of the product’s adoption has yet to occur.
Roger’s Innovation Adoption Curve
The %’s reflect the % of consumers which have adopted a product.
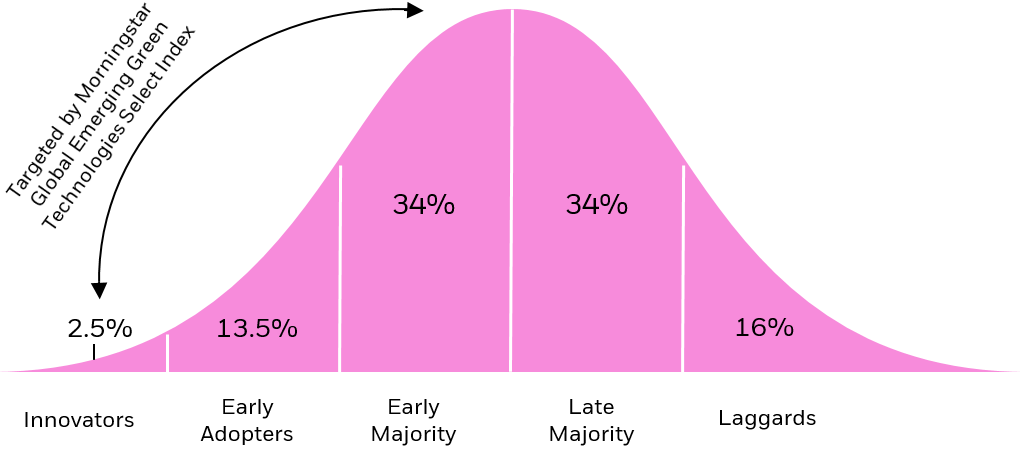
Source: Morningstar Global Emerging Green Technologies Select Index.
Chart description: The chart is an illustration of the Roger’s innovation adoption curve, which measures the cumulative rate at which a population adopts a product or service over time. The adoption stage is determined by assessing the total addressable market and market share (e.g., EVs represent <9% of total car sales in 2021 -> Early Adopters stage).
WAYS TO ACCESS ENVIRONMENTAL TECH
Investors looking to access emerging environmental technology companies may want to consider ETFs that hold pure-play firms across the full value chain of environmental technologies, targeting themes such as green transportation or clean energy.
CONCLUSION
Sixty-eight years after the first ever piece of federal air pollution legislation,42 the world has transitioned to an era of increased focus on the environment, impacting all areas of the economy. As governments, companies and consumers attempt to lessen their environmental footprint, a wide swath of environmental technologies could be positioned to benefit, and investors may benefit by holding a diversified basket of names which provide pure-play access across the full value-chain of environmental innovation.
